D.4 Resource and Entity Costing
There are two types of cost related information available within a model: resource cost and entity cost. Both of these cost models support the tabulation of costs that can support an activity based costing (ABC) analysis within a model. Activity based costing is a cost management system that attempts to better allocate costs to products based on the activities that they experience within the firm rather than a simple direct and indirect cost allocation. The details of activity based costing will not be discussed within this text; however, how tabulates costs will be examined so that you can understand how to utilize the cost estimates available on the summary reports.
D.4.1 Resource Costing
Resource costing allows costs to be tabulated based on the time a resource is busy or idle. In addition, a cost can be assigned to each time the resource is used. Let’s take a look at a simple example to illustrate these concepts. In SMARTS file, Smarts019.doe, the processing of payment bills is modeled. The bills arrive according to a Poisson process with a mean of 1 bill every minute. The bills are first sent to a worker who handles the bill processing, which takes a processing time that is distributed according to a triangular distribution with parameters (0.5, 1.0, 1.5) minutes. Then the bills are sent to a worker who handles the mailing of the bills. The processing time for the mailing is also distributed according to a triangular distribution with parameters (0.5, 1.0, 1.5) minutes. Both workers are paid an hourly wage regardless of whether or not they are busy. The bill processing worker is paid $7.75/hour and the mailing worker is paid $5.15/hour. In addition, the workers are paid an additional 2 cents for each bill that they process. Management would like to tabulate the cost of this processing over an 8 hour day.
It should be clear that you can get the wage cost by simply multiplying the hourly wage by 8 hours because the workers are paid regardless of whether they are busy or idle during the period. The number of bills processed will be random and thus the total cost must be simulated. In the case of the workers getting paid differently if they are busy or idle, then the model can facilitate this calculation as well. In this example, can do all the calculations if the costs within the RESOURCE module are specified.
The model is very simple (CREATE, PROCESS, PROCESS, DISPOSE). You should refer to the Smarts019.doe file for the details of the various dialog boxes. To implement the resource costing, you must specify the RESOURCE costs as per Figure D.55.

Figure D.55: Specifying resource costs
On the Run Setup dialog make sure that the Costing check box is enabled on the Project Parameters tab. This will ensure that the statistical reports include the cost reports. will tabulate the costs and present a summary across all resources and allow you to drill down to get specific cost information for each resource for each category (busy, idle, and usage) as shown in Figure D.56.
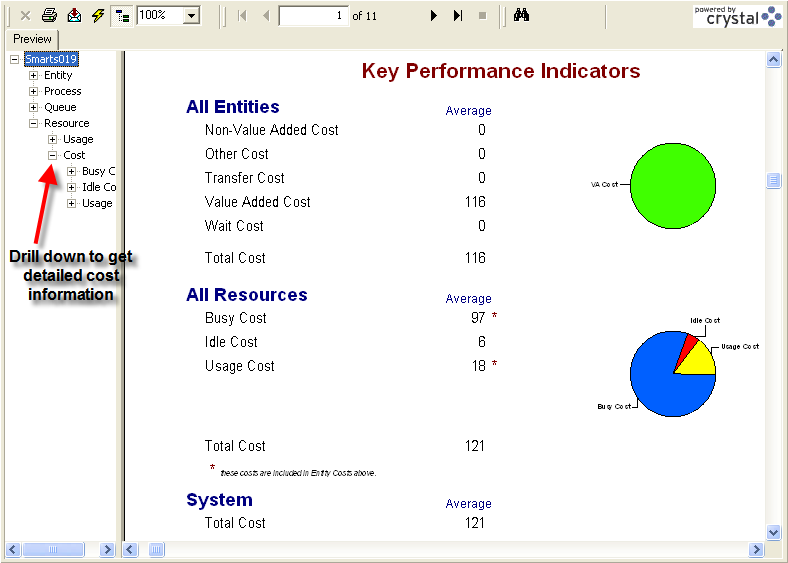
Figure D.56: Resource cost summary
Table D.1 and Table D.2 indicate how the costs are tabulated from Arena’s statistical reports for the resources. In Table D.1, the number of uses is known because there were 435 entities (bills) processed by the system. In Table D.2 the utilization from the resource statistics was used to estimate the percentage of time busy and idle. From this, the amount of time of time can be calculated and from that the cost. tabulates the actual amount of time in these categories. The value added cost calculation will be discussed shortly.
| Resource cost | $/Hour | Hours | Cost | Totals |
|---|---|---|---|---|
| Biller | 7.75 | 8 | 62.0 | |
| Mailer | 5.15 | 8 | 41.2 | |
| 103.2 | ||||
| Usage Cost | $/Usage | # Uses | Cost | |
| Biller | 0.02 | 456 | 9.12 | |
| Mailer | 0.02 | 456 | 9.12 | |
| 18.24 | ||||
| Total Cost | 121.44 |
| Resource | Util. | Time Busy | $/Hour | Cost | Total |
|---|---|---|---|---|---|
| Biller | 0.9374 | 7.50 | 7.75 | 58.12 | |
| Mailer | 0.9561 | 7.65 | 5.15 | 39.39 | |
| 97.51 | |||||
| Idle | Time Idle | $/Hour | Cost | ||
| Biller | 0.0626 | 0.50 | 7.75 | 3.88 | |
| Mailer | 0.0439 | 0.35 | 5.15 | 1.81 | |
| 5.69 | |||||
| Total Cost | 103.20 |
To contrast this consider Smarts049.doe in which the billing worker and mailing workers follow a schedule as shown in Figure D.57 and Figure D.58. Because the resources have less time available to be busy or idle the costs are less for this model as shown in Figure D.59. In this case, the workers are not paid when they are not scheduled. As can be seen in Figure D.59, Arena also tabulates costs for the entities. Let’s take a look at another example to examine how entity costs are tabulated.

Figure D.57: Smart049.doe with resources based on schedule
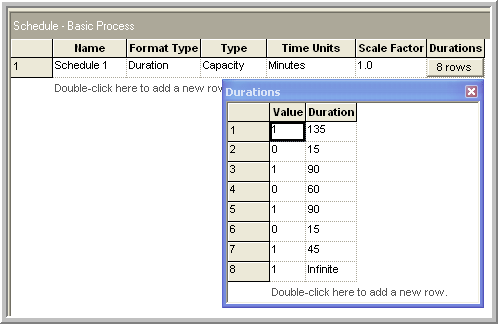
Figure D.58: Schedule for Smarts049.doe
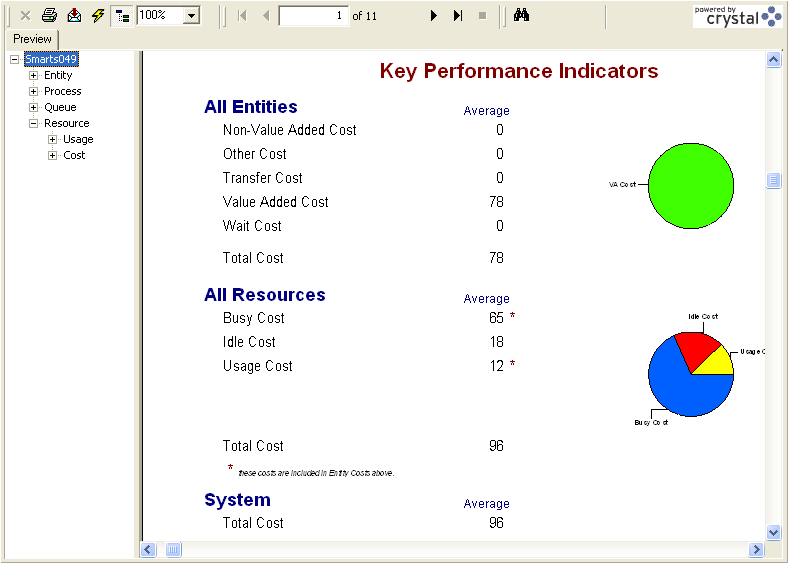
Figure D.59: Summary costs for resoruces following a schedule
D.4.2 Entity Costing
Entity costing is slightly more complex than resource costing. assigns entity costs into five different activity categories:
- Waiting time/cost
Wait time is any time designated as Wait. Waiting time in queues is by default allocated as waiting time. Waiting cost is the cost associated with an entity’s designated wait time. This cost includes the value of the time the entity spends in the waiting state and the value of the resources that are held by the entity during the time.
- Value added time/cost
Value added time is any time designated as Value added. Value added time directly contributes value to the entity during the activity. For example, the insertion of components on a printed circuit board adds value to the final product. Value added cost is the cost associated with an entity’s designated value added time. This cost includes the value of the time the entity spends in the value added activity and the value of the resources that are held by the entity during the time.
- Non-value added time/cost
Non-value added time is any time designated as Non-Value added. Non-value added time does not directly contribute value to the entity during the activity. For example, the preparation of the materials needed to insert the components on the printed circuit board (e.g. organizing them for insertion) can be considered as non-value added. The designation of non-value added time can be subjective. As a rule, if the time could be reduced or eliminated and efficiency increased without additional cost then the time can be considered as non-value added. Non-value added cost is the cost associated with an entity’s designated non-value added time. This cost includes the value of the time the entity spends in non-value added activity and the value of the resources that are held by the entity during the time.
- Transfer time/cost
Transfer time can be considered a special case of non-value added time in which the entity experiences a transfer. By default, all time spent using material handling devices from the Advanced Transfer panel (such as a conveyor or transporter) is specified as Transfer time. Transfer cost is the cost associated with an entity’s designated transfer time. This cost includes the value of the time the entity spends in the designated transfer activity and the value of the resources that are held by the entity during the time.
- Other time/cost
This category is a catch-all for any activities that do not naturally fit the other four categories.
As mentioned, designates wait and transfer time automatically based on the constructs being used. In the case of the transfer time category, you can also designate specific delays as transfer time, even if a material handling device is not used. In the modeling, it is incumbent on the modeler to properly designate the various activities within the model; otherwise, the resulting cost tabulations will be meaningless. Thus, does not do the cost modeling for you; however, it tabulates the costs automatically for you. Don’t forget the golden rule of computing: “Garbage in = Garbage out.” When you want to use for cost modeling, you need to carefully specify the cost elements within the entire model. Let’s take a closer look at how tabulates the costs.
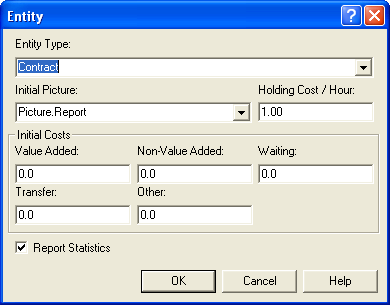
Figure D.60: ENTITY Module Costing Terms for Smarts047.doe
Entity cost modeling begins by specifying the cost rates for the types of entities in the ENTITY module. In addition, to get a meaningful allocation of the resource cost for the entity, you need to specify the costs of using the resource as per the RESOURCE module. As can be seen in Figure D.60, the ENTITY module allows the user to specify the holding cost of the entity as well as initial costs for each of the five categories. Let’s ignore the initial costs for a moment and examine the meaning of the holding cost/hour field. The holding cost per hour represents the cost of processing the entity anywhere in the system. This is the dollar value of having the entity in the system expressed as a time rate. For example, in an inventory model, you might consider this the cost of holding 1 unit of the item in the system for 1 hour. This cost can be difficult to estimate. It is typically based on a cost of capital argument; see Silver, Pyke, and Peterson (1998) for more on estimating this value. Provided the holding cost per hour for the entity is available and the resource costs are specified for the resources used by the entity, can tabulate the costs.
Let’s consider tabulating the value-added cost for an entity. As an entity moves through the model, it will experience activities designated as value-added. Let \(n\) be the number of value-added activity periods experienced by the entity while in the system. Let \(\mathit{VAT}_i\) be the value-added time for period \(i\) and \(h\) be the holding cost rate for the entity’s type. While the entity is experiencing the activity, it may be using various resources. Let \(r_i\) be the number of resources used by the entity in activity period \(i\) and let \(b_i\) be the busy cost per hour for the \(j^{th}\) resource held by the entity in period \(i\). Let \(u_i\) be the usage cost associated with the \(j^{th}\) resource used during the activity. Thus, the value added cost, \(\mathit{VAC}_i\), for the \(i^{th}\) period is:
\[\begin{aligned} \mathit{VAC}_i & = h \times \mathit{VAT}_i + \left(\sum_{j\in R_i} b_j \right) \times \mathit{VAT}_i +\sum_{j\in R_i} u_j \\ & = \left(h + \sum_{j\in R_i} b_j \right) \times \mathit{VAT}_i + \sum_{j\in R_i} u_j\end{aligned}\]
The quantity,\(\sum_{j\epsilon R_i} b_j\), is called the resource cost rate for period \(i\). Thus, the total value added cost,\(\mathit{TVAC}\), for the entity during the simulation is:
\[\mathit{TVAC} = \sum_{i=1}^{n} \mathit{VAC}_i\]
The costs for the other categories are computed in a similar fashion by noting the number of periods for the category and the associated time spent in the category by period. These costs are then totaled for all the entities of a given type.
The initial costs as specified in the ENTITY module are treated in a special manner by Arena’s cost reports. Arena’s help system has this to say about the initial costs:
The initial VA cost, NVA cost, waiting cost, transfer cost and other cost values specified in this module are automatically assigned to the entity’s cost attributes when the entity is created. These initial costs are not included in the system summary statistics displayed in the Category Overview and Category by Replication reports. These costs are considered to have been incurred outside the system and are not included in any of the All Entities Cost or the Total System Cost. These initial costs are, however, included in the cost statistics by entity type.
To illustrate entity cost modeling, consider SMARTS file Smarts047.doe. In this model contracts arrive according to a Poisson process with a mean rate of 1 contract per hour. There are two value added processes on the contract: an addendum is added to the contract and a notary signs the contract. These processes each take TRIA(0.5, 1. 1.5) hours to complete. The contract processor has an $8/hour busy/idle cost. The notary is paid on a per usage basis of $10 per use. The holding cost is $1 per hour for the contracts. These values are shown in Figure D.61, Figure D.60, and Figure D.62 illustrates how to allocate the value added time within the contract addendum process.

Figure D.61: Resource Costs for Smarts047.doe
By running this model with 1 entity, you can more easily see how the value added costs are tabulated. If you run the model, the value added cost for 1 entity is about $19.
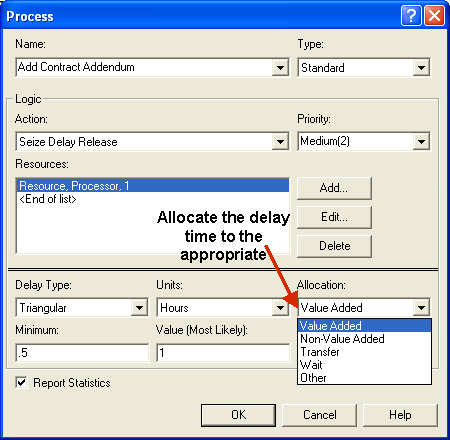
Figure D.62: Allocating the value added time
Figure D.63 indicates that the value added processing time for the contract at the addendum process was 55.4317 minutes. This can be converted to hours as shown in Table D.3. Then the cost per hour for the entity in the system (holding cost plus resource cost) is tabulated (e.g. $1 + $8 = $9). This is multiplied by the value added time in hours to get the cost of the process. If the resource for the process has a resource cost then it must be included as shown in Table D.3 and as explained in the equation for \(\text{VAC}_i\).
| Process | VAT | VAT | Holding | Resource | Usage | Total | ||
| (minutes) | (hours) | Cost($/hr) | Cost($/hr) | Cost($/hr) | Cost | Cost | Cost | |
| Addendum | 55.4317 | 0.9238617 | $1.00 | $8.00 | $9.00 | $8.31 | $0.00 | $8.31 |
| Notary | 50.6456 | 0.8440933 | $1.00 | $0.00 | $1.00 | $0.84 | $10.00 | $10.84 |
| $19.16 |
To get the cost for the entire simulation, this calculation would be done for each contract entity for every value added activity experienced by the entity. In the case of the single entity, the total cost of $19.16 for the addendum and notary activities is shown in Table D.3.
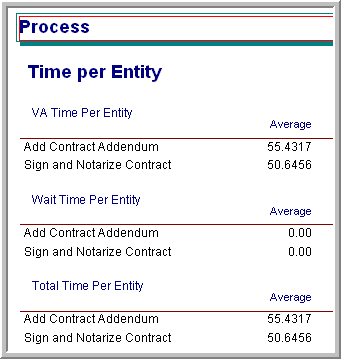
Figure D.63: Processing time
Again, when using the costing constructs within your models you should be extra diligent in entering the information and in understanding the effect of specifying entity types. The following issues should be thought about with care:
Make sure that only those DISPOSE modules for which you want entity statistics tabulated have their entity statistic check box enabled.
Make sure that you use the ENTITY module and specify the type of entity to create within your CREATE modules.
Carefully specify the allocation for your activities. For example, if you want an entity’s value added cost, then you must allocate to value added for every pertinent value added activity that the entity may experience within the model.
Make sure to read carefully how the BATCH and SEPARATE module’s handle the assignment of entity attributes so that the proper attribute values are carried by the entities. Specify the attribute assignment criteria that best represents your situation.
Read carefully how handles PROCESS sub-models and regular sub-models in terms of costing tabulation if you use sub-models. See Sub-model Processing within the help system.
Remember also that you do not have to use the built in costing models. You can specify your cost tabulations directly within the model and tabulate only the things that you need. In other words, you can do it yourself.