8.2 SM Testing Contest Problem Description
At this point you have learned a great deal concerning the fundamentals of simulation modeling and analysis. The purpose of this section is to help you to put your new knowledge into practice by demonstrating the modeling and analysis of a system in its entirety. Ideally, experience in simulating a real system would maximize your understanding of what you have learned; however, a realistic case study should provide this experience within the limitations of the textbook. During the past decade, Rockwell Software (the makers of ) and the Institute of Industrial Engineers (IIE) have sponsored a student contest involving the use of to model a realistic situation. The contest problems have been released to the public and can be found on the main Arena web-site. This section will solve one of the previous contest problems. This process will illustrate the simulation modeling steps from conceptualization to final recommendations. After solving the case study, you should have a better appreciation for and a better understanding of the entire simulation process.
This section reproduces in its entirety the \(7^{th}\) Annual Contest Problem entitled: SM Testing. Then, the following sections present a detailed solution to the problem. As you read through the following section, you should act as if you are going to be required to solve the problem. That is, try to apply the simulation modeling steps by jotting down your own initial solution to the problem. Then, as you study the detailed solution, you can compare your approach to the solution presented here.
Rockwell Software/IIE 7th Annual Contest Problem: SM
Testing
SM Testing is the parent company for a series of small medical
laboratory testing facilities. These facilities are often located in or
near hospitals or clinics. Many of them are new and came into being as a
direct result of cost-cutting measures undertaken by the medical
community. In many cases, the hospital or clinic bids their testing out
to an external contractor, but provides space for the required
laboratory within their own facility.
SM Testing provides a wide variety of testing services and has long-term plans to increase our presence in this emerging market. Recently, we have concentrated on a specific type of testing laboratory and have undertaken a major project to automate most of these facilities. Several pilot facilities have been constructed and have proven to be effective not only in providing the desired service, but also in their profitability. The current roadblock to a mass offering of these types of services is our inability to size the automated system properly to the specific site requirements. Although a method was developed for the pilot projects, it dramatically underestimated the size of the required system. Thus, additional equipment was required when capacity problems were uncovered. Although this trial-and-error approach eventually provided systems that were able to meet the customer requirements, it is not an acceptable approach for mass introduction of these automated systems. The elapsed time from when the systems were initially installed to when they were finally able to meet the customer demands ranged from 8 to 14 months. During that time, manual testing supplemented the capacity of the automated system. This proved to be extremely costly.
It is obvious that we could intentionally oversize the systems as a way of always meeting the projected customer demand, but it is understood that a design that always meets demand may result in a very expensive system with reduced profitability. We would like to be able to size these systems easily so that we meet or exceed customer requirements while keeping our investment at a minimum. We have explored several options to resolve this problem and have come to the conclusion that computer simulation may well provide the technology necessary to size these systems properly.
Prior to releasing this request for recommendations, our engineering staff developed a standard physical configuration that will be used for all future systems. A schematic of this standard configuration is shown in Figure 8.12.
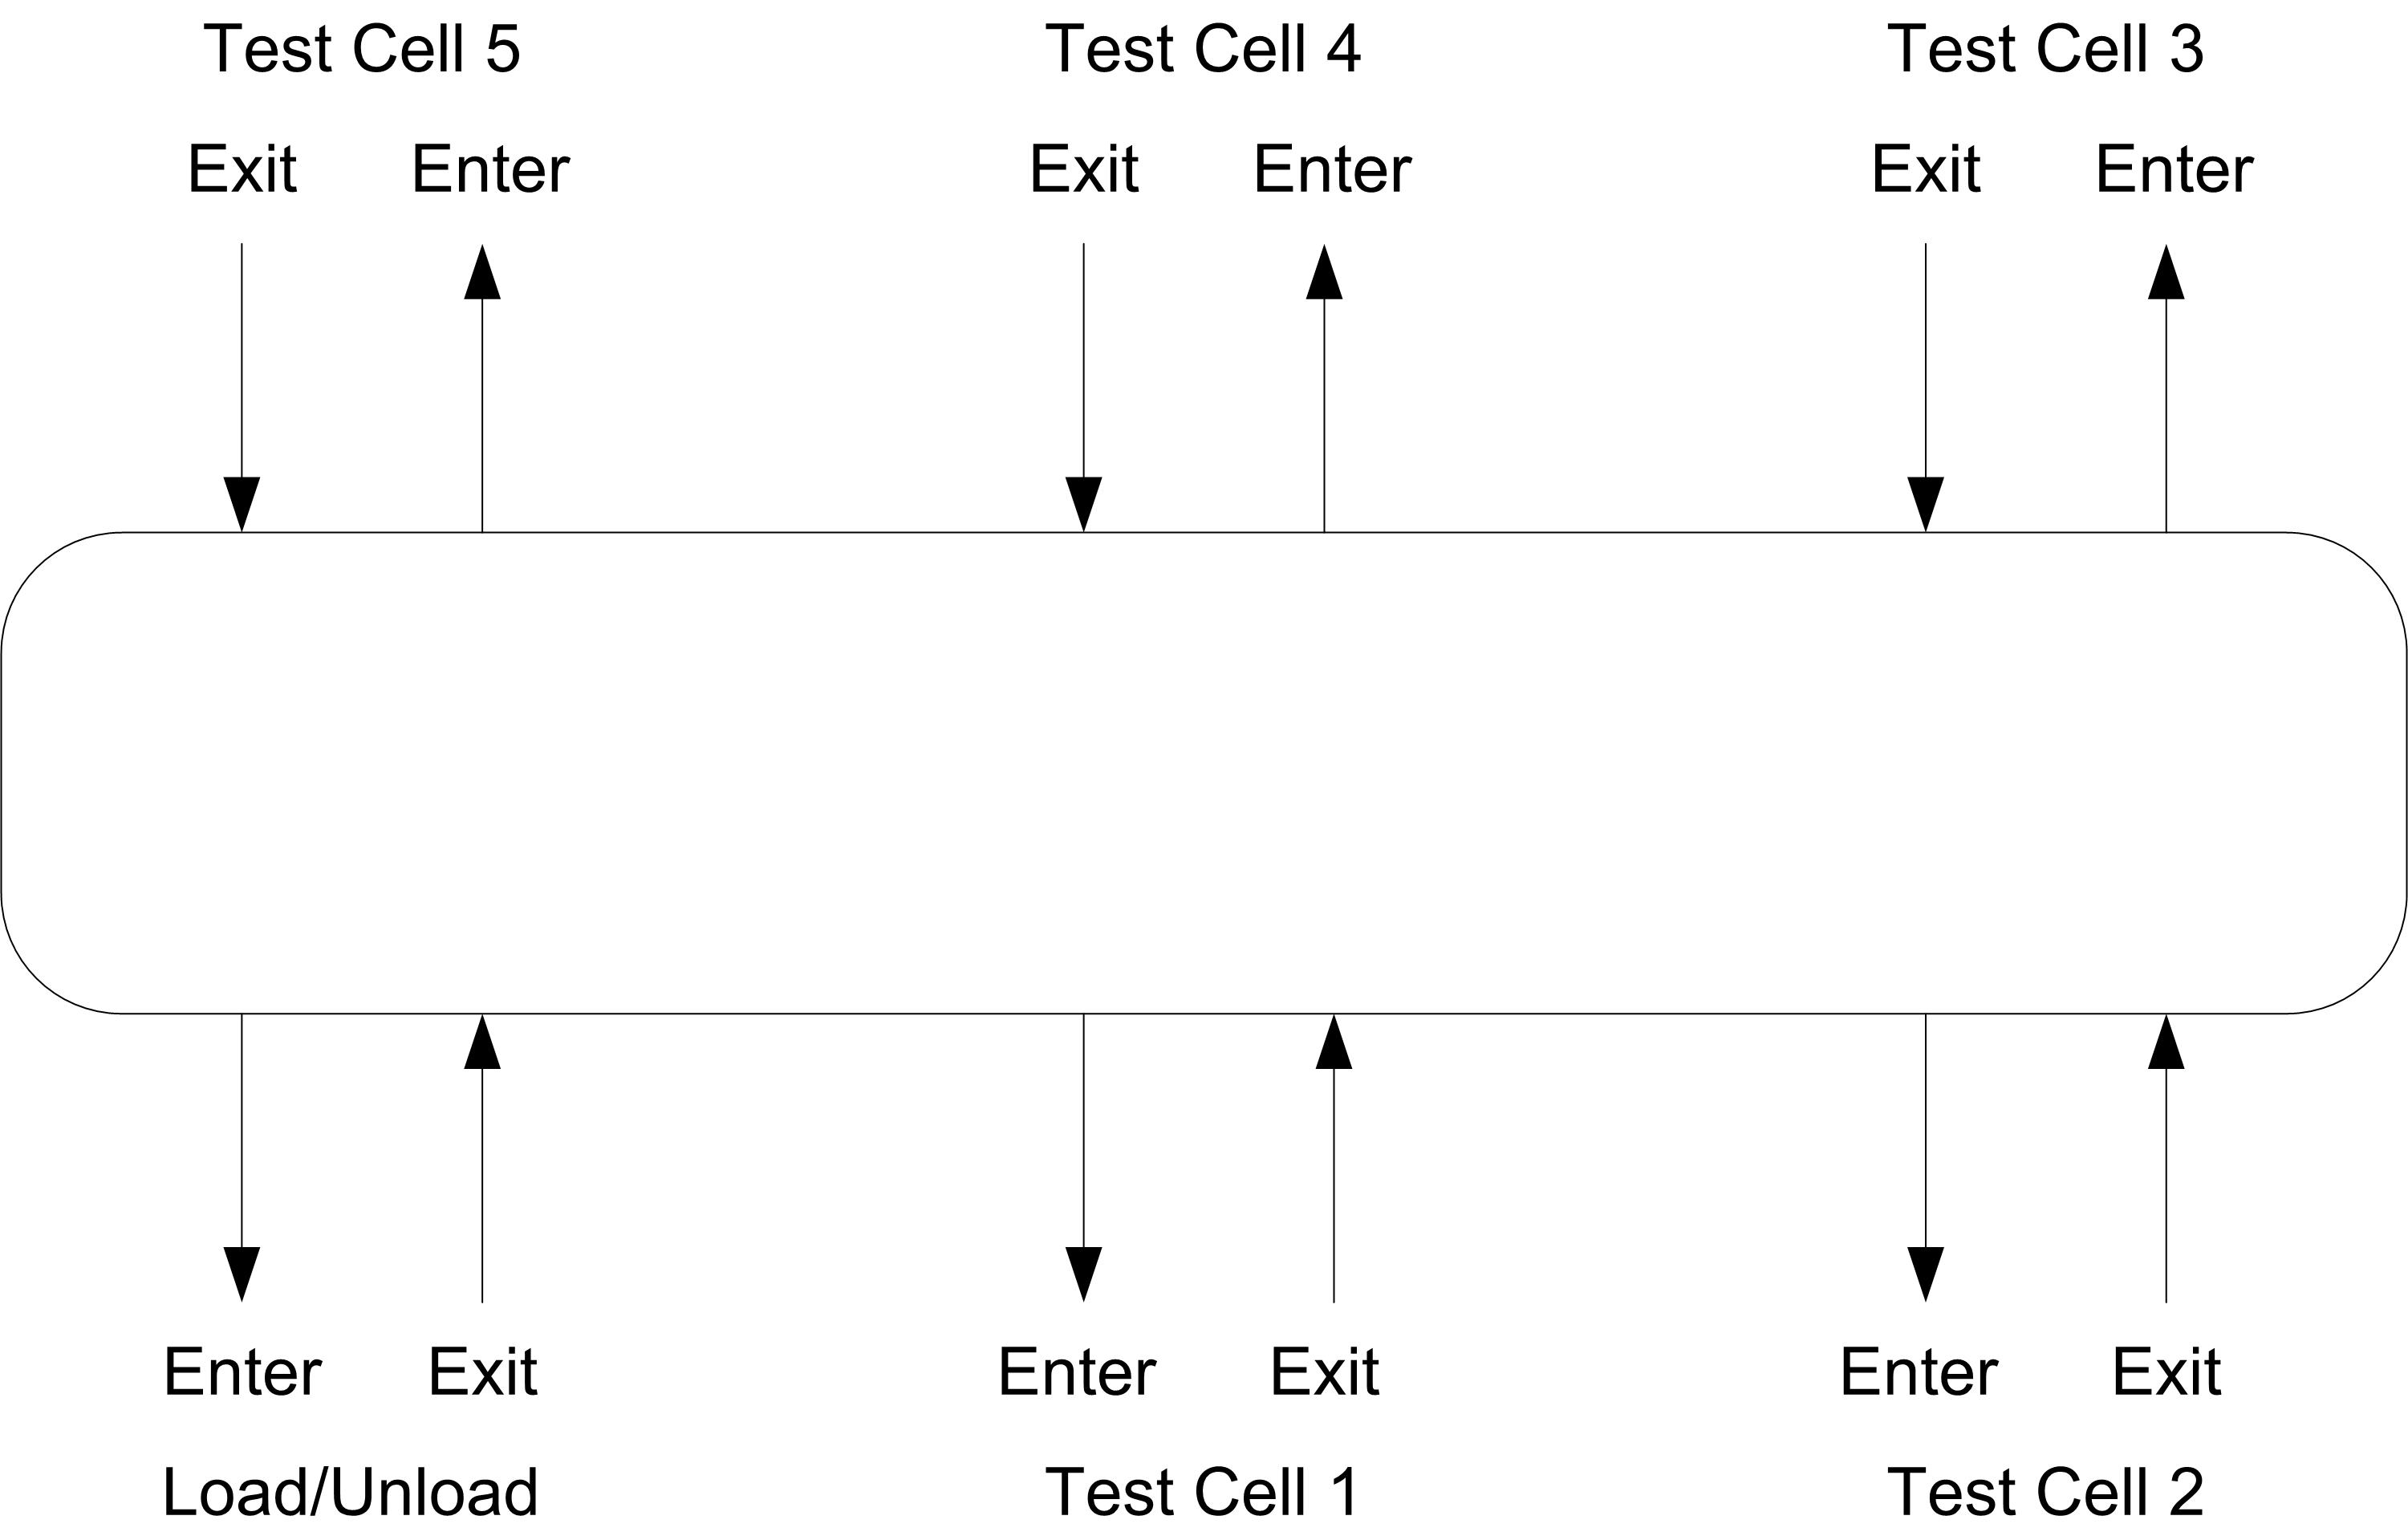
Figure 8.12: Schematic of standard configuration
The standard configuration consists of a transportation loop or racetrack joining six different primary locations: one load/unload area and five different test cells. Each testing cell will contain one or more automated testing devices that perform a test specific to that cell. The load/unload area provides the means for entering new samples into the system and removing completed samples from the system.
The transportation loop or racetrack can be visualized as a bucket conveyor or a simple power-and-free conveyor. Samples are transported through the system on special sample holders that can be thought of as small pallets or carts that hold the samples. The number of sample holders depends on the individual system. The transportation loop is 48 feet long, and it can accommodate a maximum of 48 sample holders, spaced at 1-foot increments. Note that because sample holders can also be within a test cell or the load/unload area, the total number of sample holders can exceed 48. The distance between the Enter and Exit points at the load/unload area and at each of the test cells is 3 feet. The distance between the Exit point of one cell and the Enter point of the next cell is 5 feet.
Let’s walk through the movement of a typical sample through the system. Samples arriving at the laboratory initially undergo a manual preparation for the automated system. The sample is then placed in the input queue to the load/unload area. This manual preparation typically requires about 5 minutes. When the sample reaches the front of the queue, it waits until an empty sample holder is available. At that point, the sample is automatically loaded onto the sample holder, and the unit (sample on a sample holder) enters the transportation loop. The process of a unit entering the transportation loop is much like a car entering a freeway from an on ramp. As soon as a vacant space is available, the unit (or car) merges into the flow of traffic. The transportation loop moves the units in a counterclockwise direction at a constant speed of 1 foot per second. There is no passing allowed.
Each sample is bar-coded with a reference to the patient file as well as the sequence of tests that need to be performed. A sample will follow a specific sequence. For example, one sequence requires that the sample visit Test Cells 5 – 3 – 1 (in that order). Let’s follow one of these samples and sample holders (units) through the entire sequence. It leaves Load/Unload at the position marked Exit and moves in a counterclockwise direction past Test Cells 1 through 4 until it arrives at the Enter point for Test Cell 5. As the unit moves through the system, the bar code is read at a series of points in order for the system to direct the units to the correct area automatically. When it reaches Test Cell 5, the system checks to see how many units are currently waiting for testing at Test Cell 5. There is only capacity for 3 units in front of the testers, regardless of the number of testers in the cell. This capacity is the same for all of the 5 test cells. The capacity (3) does not include any units currently being tested or units that have completed testing and are waiting to merge back onto the transportation loop. If room is not available, the unit moves on and will make a complete loop until it returns to the desired cell. If capacity or room is available, the unit will automatically divert into the cell (much like exiting from a freeway). The time to merge onto or exit from the loop is negligible. A schematic of a typical test cell is provided in Figure 8.13.
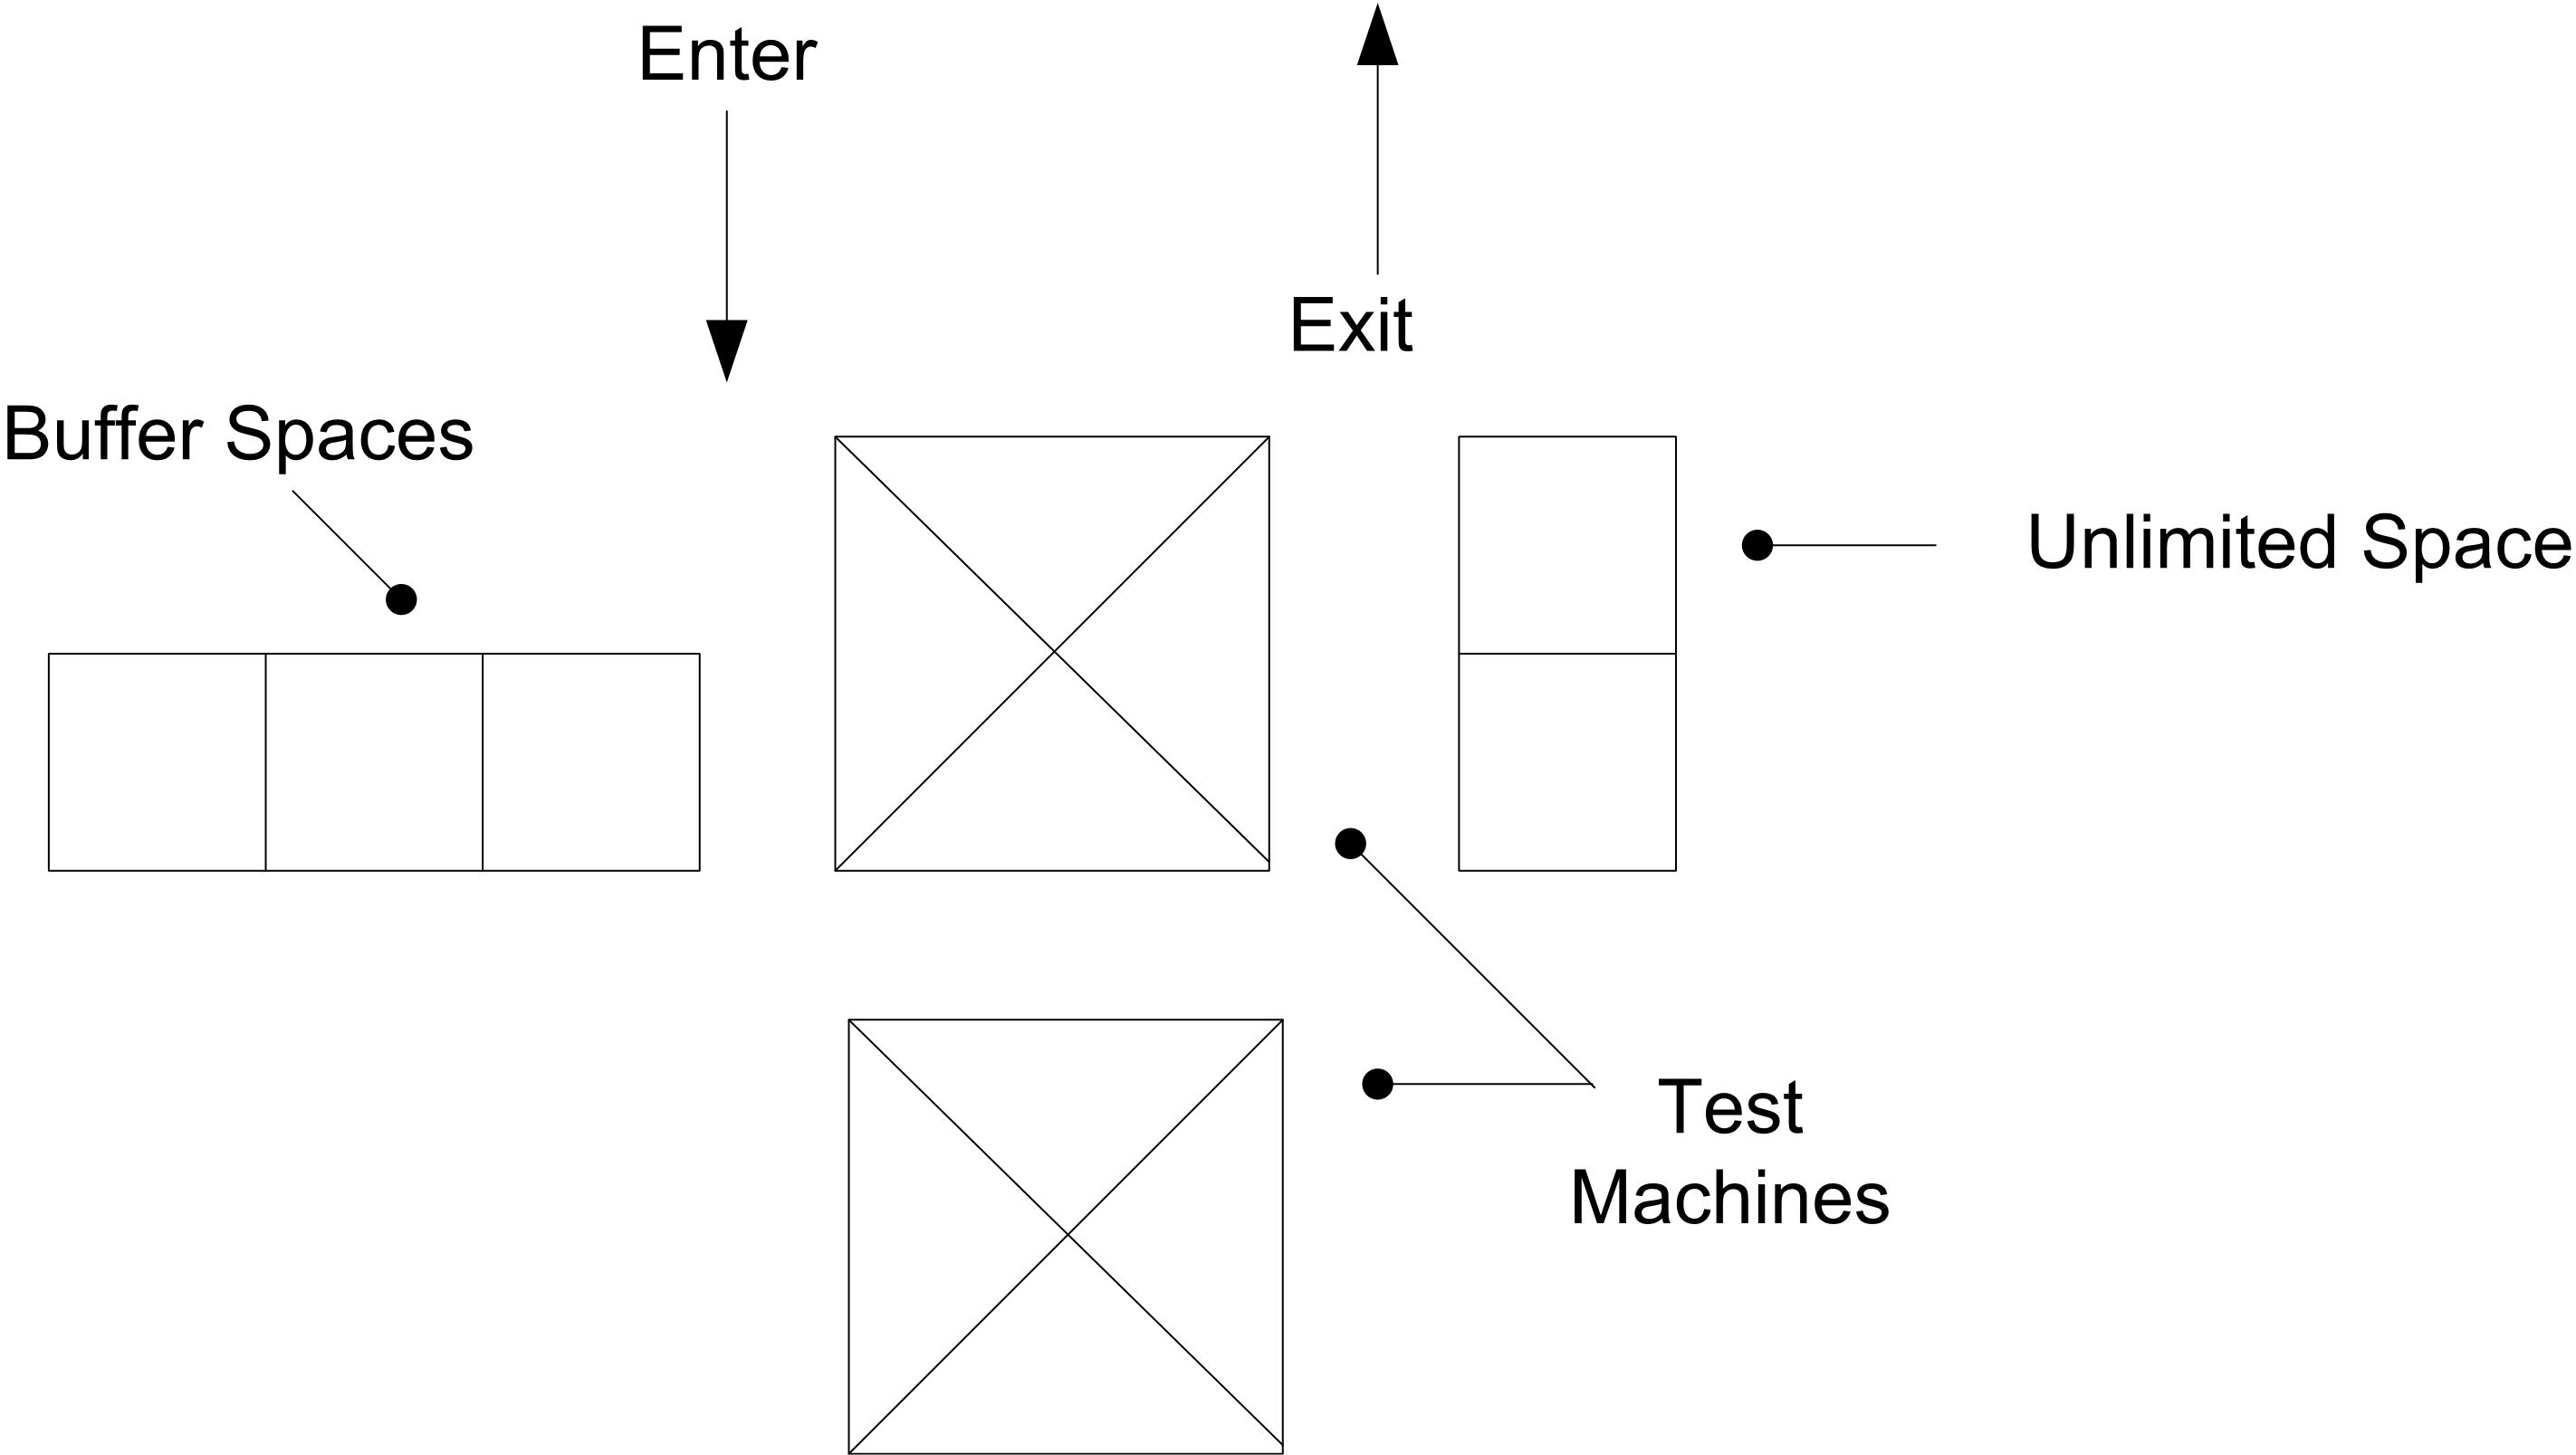
Figure 8.13: Test cell schematic
As soon as a tester becomes available, the unit is tested, the results are recorded, and the unit attempts to merge back onto the loop. Next it would travel to the Enter point for Test Cell 3, where the same logic is applied that was used for Test Cell 5. Once that test is complete, it is directed to Test Cell 1 for the last test. When all of the steps in the test sequence are complete, the unit is directed to the Enter point for the Unload area.
The data-collection system has been programmed to check the statistical validity of each test. This check is not performed until the sample leaves a tester. If the test results do not fall into accepted statistical norms, the sample is immediately sent back for the test to be performed a second time.
Although there can be a variable number of test machines at each of the test cells, there is only one device at the load/unload area. This area provides two functions: the loading of newly arrived samples and the unloading of completed samples. The current system logic at this area attempts to assure that a newly arrived sample never has to wait for a sample holder. Thus, as a sample holder on the loop approaches the Enter point for this area, the system checks to see whether the holder is empty or if it contains a sample that has completed its sequence. If the check satisfies either of these conditions, the system then checks to see if there is room for the sample holder in the load/unload area. This area has room for 5 sample holders, not including the sample holder on the load/unload device or any holders waiting to merge back onto the loop. If there is room, the sample holder enters the area. A schematic for the load/unload area is shown in Figure 8.14.
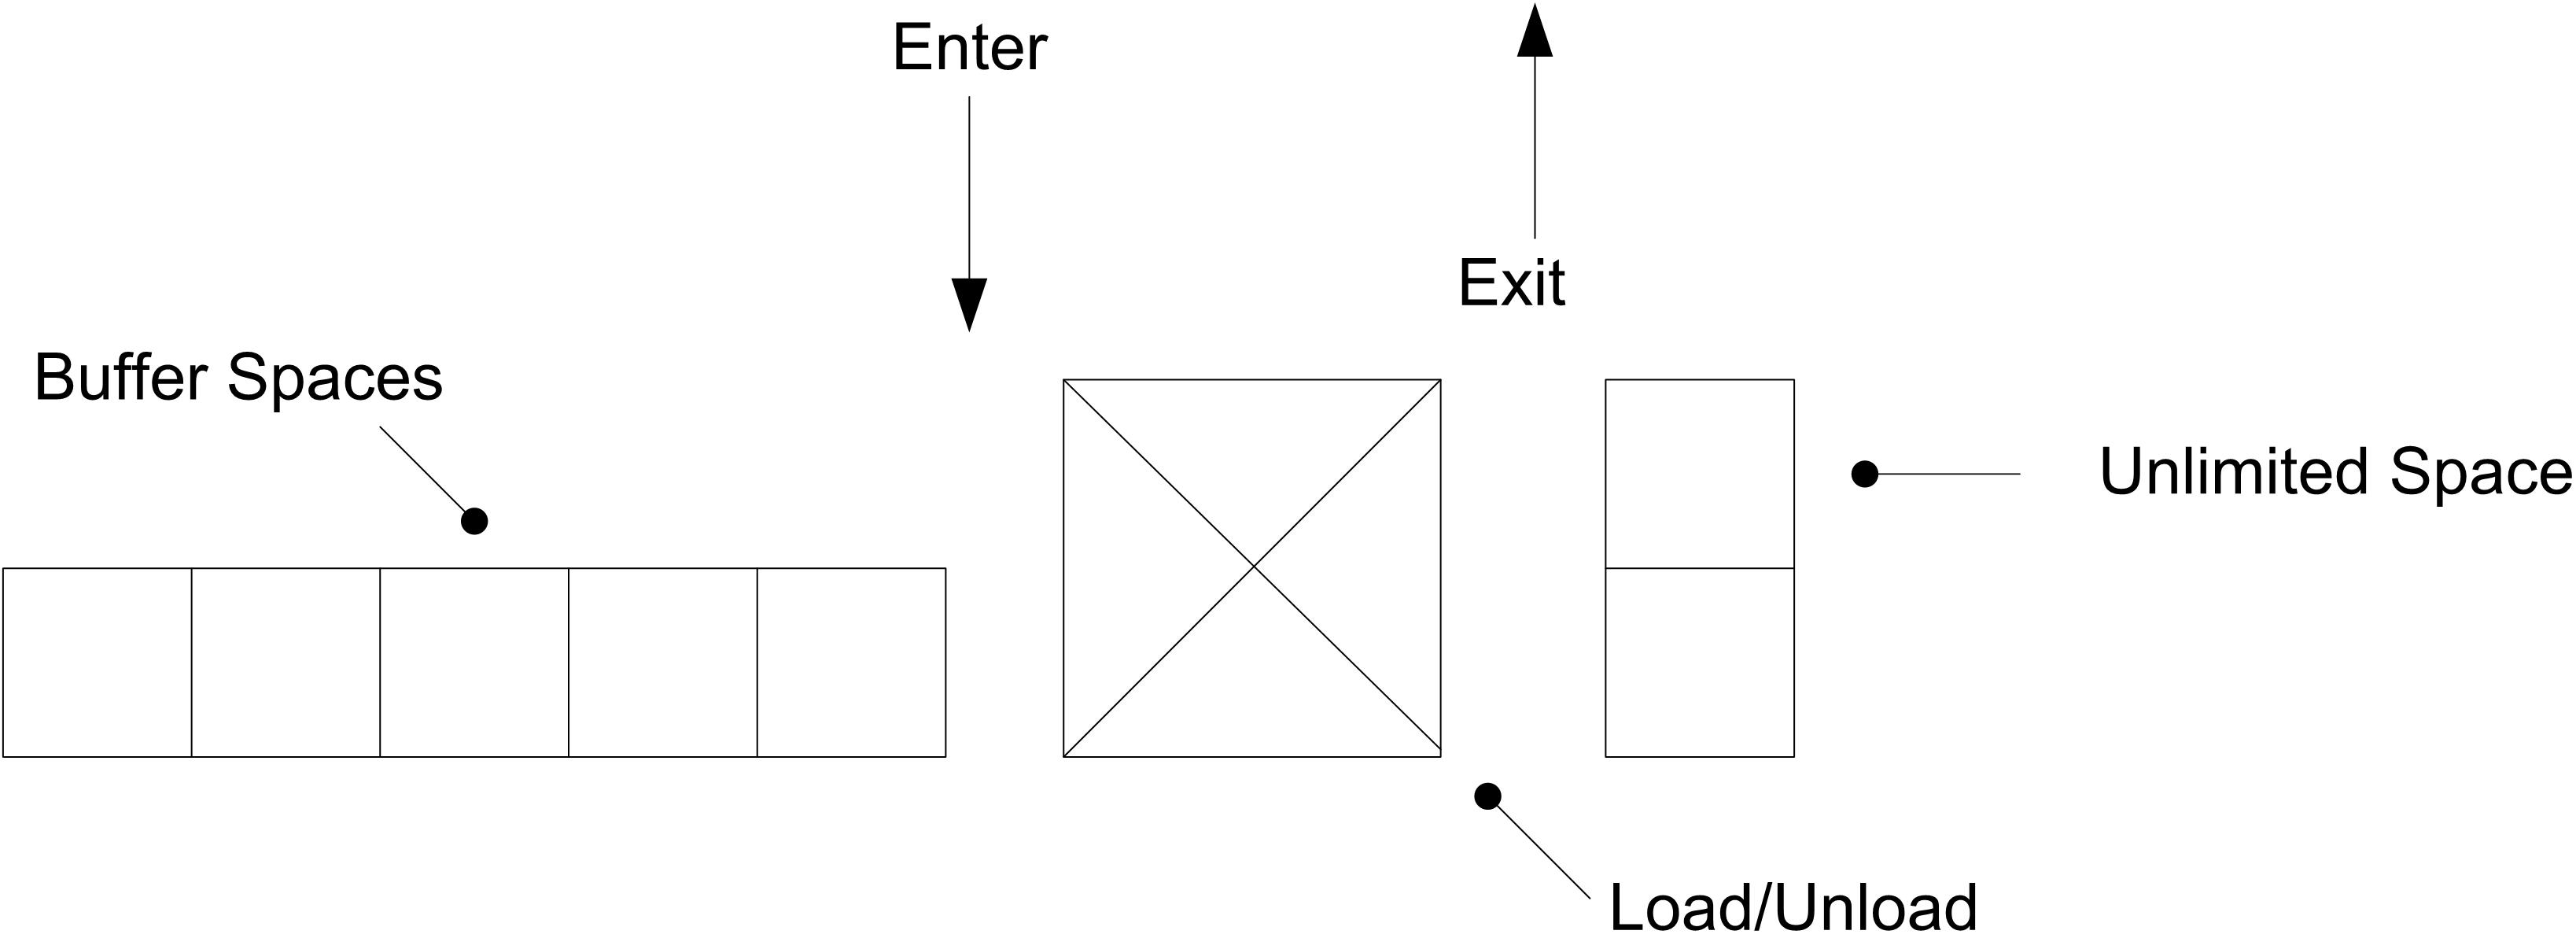
Figure 8.14: Load and unload cell schematic
As long as there are sample holders in front of the load/unload device, it will continue to operate or cycle. It only stops or pauses if there are no available sample holders to process. The specific action of this device depends on the status of the sample holder and the availability of a new sample. There are four possible actions.
The sample holder is empty and the new sample queue is empty. In this case, there is no action required, and the sample holder is sent back to the loop.
The sample holder is empty and a new sample is available. In this case, the new sample is loaded onto the sample holder and sent to the loop.
The sample holder contains a completed sample, and the new sample queue is empty. In this case, the completed sample is unloaded, and the empty sample holder is sent back to the system.
The sample holder contains a completed sample, and a new sample is available. In this case, the completed sample is unloaded, and the new sample is loaded onto the sample holder and sent to the loop.
The time for the device to cycle depends on many different factors, but our staff has performed an analysis and concluded that the cycle time follows a triangular distribution with parameters 0.18, 0.23, and 0.45 (minutes). A sample is not considered complete until it is unloaded from its sample holder. At that time, the system will collect the results from its database and forward them to the individual or area requesting the test.
The time for an individual test is constant but depends on the testing cell. These cycle times are given in Table 8.4.
| Tester | Time |
|---|---|
| 1 | 0.77 |
| 2 | 0.85 |
| 3 | 1.03 |
| 4 | 1.24 |
| 5 | 1.7 |
Each test performed at Tester 3 requires 1.6 oz of reagent, and 38% of the tests at Tester 4 require 0.6 oz of a different reagent. These are standard reagents and are fed to the testers automatically. Testers periodically fail or require cleaning. Our staff has collected data on these activities, which are given in Table 8.5 for four of the testers. The units for mean time between failures (MTBF) are hours, and the units for mean time to repair (MTTR) are minutes.
| Tester | MTBF | MTTR |
|---|---|---|
| 1 | 14 | 11 |
| 3 | 9 | 7 |
| 4 | 15 | 14 |
| 5 | 16 | 13 |
The testers for Test Cell 2 rarely fail, but they do require cleaning after performing 300 tests. The clean time follows a triangular distribution with parameters (5, 6, 10) (minutes).
The next pilot-testing laboratory will be open 24 hours a day, seven days a week. Our staff has projected demand data for the site, which are provided Table 8.6. Hour 1 represents the time between midnight and 1 AM. Hour 24 represents the time between 11 PM and midnight. The rate is expressed in average arrivals per hour. The samples arrive without interruption throughout the day at these rates.
| Hour | Rate | Hour | Rate | Hour | Rate |
|---|---|---|---|---|---|
| 1 | 119 | 9 | 131 | 17 | 134 |
| 2 | 107 | 10 | 152 | 18 | 147 |
| 3 | 100 | 11 | 171 | 19 | 165 |
| 4 | 113 | 12 | 191 | 20 | 155 |
| 5 | 123 | 13 | 200 | 21 | 149 |
| 6 | 116 | 14 | 178 | 22 | 134 |
| 7 | 107 | 15 | 171 | 23 | 119 |
| 8 | 121 | 16 | 152 | 24 | 116 |
Each arriving sample requires a specific sequence of tests, always in the order listed. There are nine possible test sequences with the data given in Table 8.7.
| # | Test Cells | (%) |
|---|---|---|
| 1 | 1-2-4-5 | 9 |
| 2 | 3-4-5 | 13 |
| 3 | 1-2-3-4 | 15 |
| 4 | 4-3-2 | 12 |
| 5 | 2-5-1 | 7 |
| 6 | 4-5-2-3 | 11 |
| 7 | 1-5-3-4 | 14 |
| 8 | 5-3-1 | 6 |
| 9 | 2-4-5 | 13 |
Our contracts generally require that we provide test results within one hour from receipt of the sample. For this pilot, we also need to accommodate Rush samples for which we must provide test results within 30 minutes. It is estimated that 7% of incoming samples will be labeled Rush. These Rush samples are given preference at the load area.
We requested and received cost figures from the equipment manufacturers. These costs include initial capital, operating, and maintenance costs for the projected life of each unit. The costs given in Table 8.8 are per month per unit.
From this simulation study, we would like to know what configuration would provide the most cost-effective solution while achieving high customer satisfaction. Ideally, we would always like to provide results in less time than the contract requires. However, we also do not feel that the system should include extra equipment just to handle the rare occurrence of a late report.
| Equipment | Cost $ per month |
|---|---|
| Tester Type 1 | 10,000 |
| Tester Type 2 | 12,400 |
| Tester Type 3 | 8,500 |
| Tester Type 4 | 9,800 |
| Tester Type 5 | 11,200 |
| Sample holder | 387 |
During a recent SM Testing meeting, a report was presented on the observations of a previous pilot system. The report indicated that completed samples had difficulty entering the load/unload area when the system was loaded lightly. This often caused the completed samples to make numerous loops before they were finally able to exit. A concern was raised that longer-than-necessary test times potentially might cause a system to be configured with excess equipment.
With this in mind, we have approached our equipment vendor and have requested a quote to implement alternate logic at the exit point for the load/unload area only. The proposal gives priority to completed samples exiting the loop. When a sample holder on the loop reaches the Enter point for this area, the system checks the holder to see whether it is empty or contains a sample that has completed its sequence. If the sample holder contains a completed sample and there is room at Load/Unload, it leaves the loop and enters the area. If the sample holder is empty, it checks to see how many sample holders are waiting in the area. If that number is fewer than some suggested number, say 2, the sample holder leaves the loop and enters the area. Otherwise, it continues around the loop. The idea is always to attempt to keep a sample holder available for a new sample, but not to fill the area with empty sample holders. The equipment vendor has agreed to provide this new logic at a one-time cost of $85,000. As part of your proposal, we would like you to evaluate this new logic, including determining the best value of the suggested number.
Your report should include a recommendation for the most cost-effective system configuration. This should include the number of testers at each cell, the number of sample holders, and a decision on the proposed logic. Please provide all cost estimates on a per-month basis.
We are currently proceeding with the construction of this new facility and will not require a solution until two months from now. Since there are several groups competing for this contract, we have decided that we will not provide additional information during the analysis period. However, you are encouraged to make additional reasonable, documented assumptions. We look forward to receiving your report on time and reviewing your proposed solution.