3.6 Tabulating Frequencies using the STATISTIC Module
Time based variables within a simulation take on a particular value for
a duration of time. For example, consider a variable like NQ(Queue Name)
which represents the number of entities currently waiting in the named
queue. If \(\mathit{NQ}\) equals zero, the queue is considered empty. You
might want to tabulate the time (and percentage of time) that the queue
was empty. This requires that you record when the queue becomes empty
and when it is not empty. From this, you can summarize the time spent in
the empty state. The ratio of the time spent in the state to the total
time yields the percentage of time spent in the state and under certain
conditions, this percentage can be considered the probability that the
queue is empty.
To facilitate statistical collection of these quantities, the
frequencies option of the STATISTIC module can be used. With the
frequency option, you specify either a value or a range of values over
which you want frequencies tabulated. For example, suppose that you want
to know the percentage of time that the queue is empty, that it has 1 to
5 customers, and 6 to 10 customers. In the first case (empty), you need
to tabulate the total time for which \(\mathit{NQ}\) equals 0. In the
second case, you need to tabulate the total time for which there were 1,
2, 3, 4, or 5 customers in the queue. This second case can be specified
by a range. For the frequency statistics module, the range is specified
such that it does not include the lower limit. For example, if
\(\mathit{LL}\) represents the lower limit of the range and \(UL\)
represents the upper limit of the range the time tabulation occurs for
the values in \((\mathit{LL}, \mathit{UL}]\). Thus, to collect the time
that the queue has 1 to 5 customers, you would be specify a range (0,
5]. Frequencies can also be tabulated over the states of a resource,
essentially using the STATE(Resource Name) variable.
The file, STEM_Mixer_Frequencies.doe that accompanies this chapter illustrates the use the frequencies option. Figure 3.35 and Figure 3.36 show how to collect frequencies on a queue and on a resource. In Figure 3.36, the categories for the frequency tabulation on the queue have been specified. There have been three categories defined (empty, 1 to 5, and 6 to 10). Since the empty category is defined solely on a single value it is considered as a constant. The other two categories have been defined as ranges. The user needs to provide the value in the case of the constant or a range of values, as in the case of a range. Notice how the range for 1 to 5 has a low value specified as 0 and a high value specified as 5. This is because the lower value of the range is not included in the range. The specification of categories is similar to specifying the bins in histogram. The frequencies option will collect the time spent in each of these categories and also the percentage of the total time within each category.
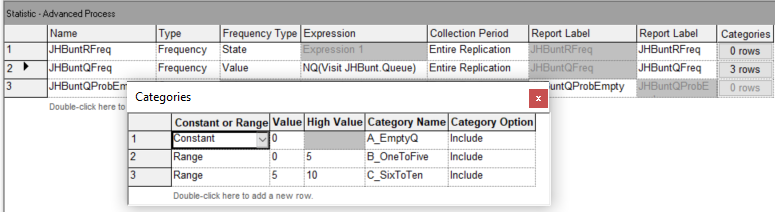
Figure 3.35: Setting up the frequency option for the JHBunt queue using the statistics module
In Figure 3.36, the frequency option is used to automatically track the states of the JHBunt recruiter resource. Resources automatically have a default state set defined which include BUSY and IDLE. Chapter 6 discusses describes additional resource modeling that includes states INACTIVE and FAILED. Since the frequency option will collect the percentage of time spent in the associated states, this represents another method for collecting the utilization of resources. More generally, you can define any state set and track statistics on time spent in the states based on general model logic.
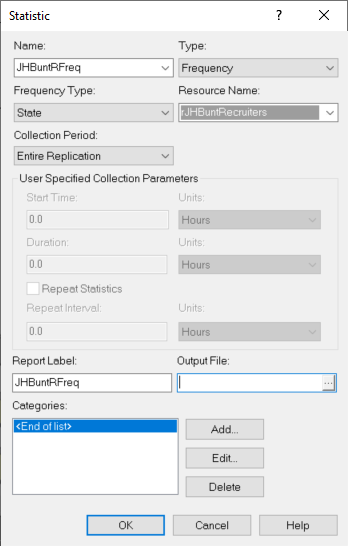
Figure 3.36: Setting up the frequency option for the JHBunt resource using the statistics module
The following quantities will be tabulated for a frequency (as per the help files).
- FAVG (Frequency ID, Category)
Average time in category. FAVG is the average time that the frequency expression has had a value in the specified category range. FAVG equals FRQTIM divided by FCOUNT.
- FCATS (Frequency ID)
Number of categories. FCATS returns the number of categories of a frequency, including the out-of-range category. FCATS is an integer value.
- FCOUNT (Frequency ID, Category)
Frequency category count. FCOUNT is the number of occurrences of observations for the Frequency Number of values in the Category number; it is an integer value. Only occurrences of time \(> 0\) are counted.
- FHILIM (Frequency ID, Category)
Frequency category high limit. FHILIM is the upper limit of a category range or simply the value if no range is defined for the particular Category number of Frequency Number. FHILIM is user-assignable.
- FLOLIM (Frequency ID, Category)
Frequency category low limit. FLOLIM defines the lower limit of a frequency category range. Values equal to FLOLIM are not included in the Category; all values larger than FLOLIM and less than or equal to FHILIM for the category are recorded. FLOLIM is user-assignable.
- FSTAND (Frequency ID, Category)
Standard category percent. FSTAND calculates the percent of time in the specified category compared to the time in all categories.
- FRQTIM (Frequency ID, Category)
Time in category. FRQTIM stores the total time of the frequency expression value in the defined range of the Category number.
- FRESTR (Frequency ID, Category)
Restricted category percent. FRESTR calculates the percent of time in the specified category compared to the time in all restricted categories.
- FTOT (Frequency ID)
Total frequency time. FTOT records the total amount of time that frequency statistics have been collected for the specified Frequency Number.
- FTOTR (Frequency ID)
Restricted frequency time. FTOTR records the amount of time that the specified Frequency Number has contained values in non-excluded categories (i.e., categories that have a value in the restricted percent column).
- FVALUE (Frequency ID)
Last recorded value. FVALUE returns the last recorded value for the specified frequency. When animating a frequency histogram, it is FVALUE, not the FAVG, which is typically displayed.
Notice that the number of occurrences or number of times that the category was observed is tallied as well as the time spent in the category. The user has the opportunity to include or exclude a particular category from the total time. This causes two types of percentages to be reported: standard and restricted. The restricted percentage is computed based on the total time that has removed any excluded categories.
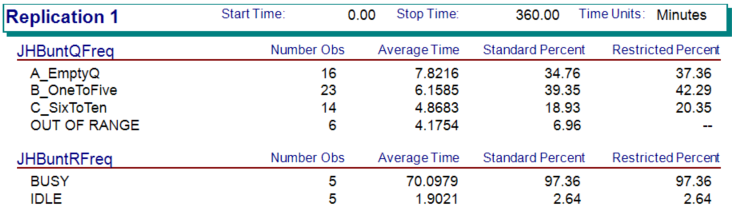
Figure 3.37: Replication 1 frequency output for STEM Mixer
Figure 3.37 illustrates the results from running the STEM mixer model for 30 replications of 360 minutes. For the frequency tabulation on the number students in the JHBunt recruiter queue, there are four not three categories listed. The last category, OUT OF RANGE, records frequencies any time the value of the variable is not in one of the previously defined categories. Note that the categories do not have to define contiguous intervals. As indicated in the figure, the OUT OF RANGE category is automatically excluded from the restricted percentage column. If you add up the percentages in the standard percent column (\(34.76 + 39.35 + 18.93 + 6.96 = 100\)), we see that they add up to 100 percent. The restricted percent column excludes the OUT OF RANGE category and redistributes the time accordingly. Figure 3.38 illustrates the spreadsheet tabulation of the frequency results. This file is available in the book support files for this chapter as FrequenciesCalculations.xlsx. If the number of observations is multplied by the average time in the category, then we get the total time spent in the category. The total of this time should be equal to the time over which the category was observed, in this case 360 minutes. Notice that the OUT OF RANGE category is restricted from the total time to produce the restricted percentages.
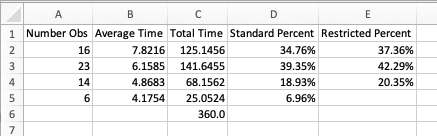
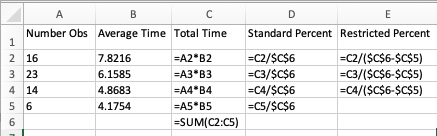
Figure 3.38: Spreadsheet tabulation of frequency data
When using frequencies, the frequencies will be tabulated for each
replication; however, frequency statistics are not automatically
tabulated across replications. To tabulate across replications, you can
define an OUTPUT statistic and use one of the previously discussed
frequency functions (e.g. FRQTIM, FAVG, etc.). The frequency element
allows finer detail on the time spent in user defined categories. This
can be very useful, especially, when analyzing the effectiveness of
resource staffing schedules. Figure 3.39 illustrates how to set up an OUTPUT statistic to collect the percentage of time that the queue is empty across the replications.
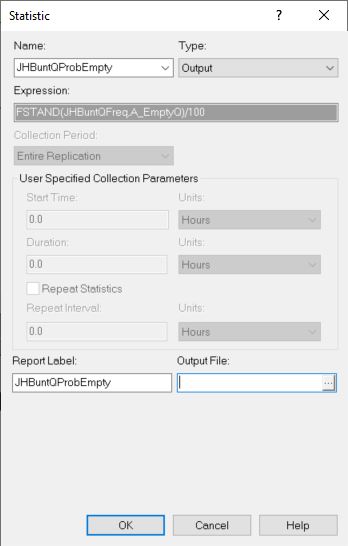
Figure 3.39: Collecting frequency statistics across replications
The results from running the model for 30 replications are shown in Figure 3.40. We see that there is about a 38% of the time the queue is empty.
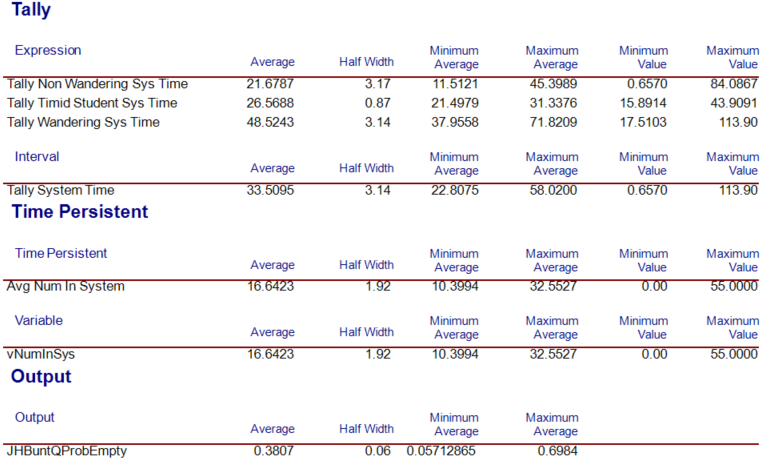
Figure 3.40: Across replication results for probability that the queue is empty
In the following section, we summarize the coverage of this chapter.