8.10 Exercises
Exercise 8.2 What solution should be recommended if the probability of meeting the contract requirements is specified as 95% for non-rush and rush samples?
Exercise 8.4 Revise the model to handle the situation of re-testing at each test cell. Assume that a re-test occurs with a 3% chance and then test the sensitivity of this assumption.
Exercise 8.8 This problem analyzes the cost associated with the LOTR, Inc. configurations described in Example 4.2 of Section 4.5. In particular, the master ring maker cost $30 per hour whether she is busy or idle. Her time is considered value added. The rework craftsman earns $22 per hour; however, his time is considered non-value added since it could be avoided if there were no rework. Both the master ring maker and the rework craftsman earn $0.50 for each ring that they work on. The inspector earns $15 per hour without any piece work considerations, and the packer earns $10 per hour (again with no piece work). The inspection time is considered non-value added; however, the packing time is considered value-added. The work rules for the workers include that they should get a 10 minute break after 2 hours into their shift, a 30 minute lunch after 4 hours into their shift, a 10 min break 2 hours after the completion of lunch, and a 15 minute clean up allowance before the end of the shift.
While many would consider a magic ring priceless, LOTR, Inc. has valued a pair of rings at approximately $10,000. The holding charge for a ring is about 15% per year. Assume that there are 365 days in a year and that each day has 24 hours when determining the holding cost per hour for the pair of rings. Simulate configuration 1 and configuration 2 as given in Section 4.5 and report the entity and resource costs for the configurations. Which configuration would you recommend?
Exercise 8.9 Reconsider Exercise 5.10 of Chapter 5. Suppose that you are interested in checking the sensitivity of a number of configurations and possibly picking the best configuration based on the part system time. The factors of interest are given in the following table.
| Factor | Levels |
|---|---|
| Preparation Space | 4 or 8 |
| Number of tooling fixtures | 10 or 15 |
| Part 2 & 3 processing distribution | TRIA(5, 10, 15) or LOGN(10, 2) |
Use the Process Analyzer to examine these system configurations within an experimental design.
Based on system time recommend a configuration that has the smallest system time with 95% confidence on your overall decision.
Base your analysis on 30 replications of length 1000 hours and a warm up period of 200 hours.
- A
There are two waiting lines at check-in. One line is dedicated to frequent flyers and one line is dedicated to non-frequent flyers. Assign 3 of the current check-in agents to serve non-frequent flyers only and the remaining agent to serve frequent flyers only. Customers must enter the appropriate line. There are two lines at boarding pass review. One line is for frequent flyers and the other is for non-frequent flyers. One TSA agent is dedicated to non-frequent flyers. The other TSA agent is shared between the two. The TSA agent that serves both shows higher priority to frequent flyers.
- B
There are two waiting lines. One line is dedicated to frequent flyers and one line is dedicated to non-frequent flyers. There are 3 check-in agents to serve non-frequent flyers and the fourth agent can serve both frequent flyers and non-frequent flyers. In other words, the agent dedicated to frequent flyers is shared. Non-frequent flyer agents should be selected before the frequent flyer agent when serving the non-frequent flyer line, when more than on agent is available and a customer is waiting. When there are no frequent flyers waiting in the frequent-flyer queue, the agent can serve a non-frequent flyer if one is waiting. The agents serve the lines with the same priority. There are two lines at boarding pass review. One line is for frequent flyers and the other is for non-frequent flyers. One TSA agent is dedicated to non-frequent flyers. The other TSA agent is shared between the two. The TSA agent that serves both shows higher priority to frequent flyers.
- C
This alternative is the same as alternative B, except that the frequent flyer agent serves frequent flyers with higher priority than waiting non-frequent flyers at check-in.
Report the average and 95% confidence interval half-width for the following based on the simulation of 50 days of operation:
| Alternative | Statistic | Average | Half-Width |
|---|---|---|---|
| A | Frequent Flyer Total time in the system | ||
| A | Non-Frequent Flyer Total time in the system | ||
| B | Frequent Flyer Total time in the system | ||
| B | Non-Frequent Flyer Total time in the system | ||
| C | Frequent Flyer Total time in the system | ||
| C | Non-Frequent Flyer Total time in the system |
Recommend with 95% confidence the best alternative A, B, or C for frequent flyers in terms of total time in the system. Use an indifference parameter of 0 minutes.
Recommend with 95% confidence the best alternative A, B, or C for non-frequent flyers in terms of total time in the system. Use an indifference parameter of 0 minutes.
In general, an overview of the vaccination process is as follows:
Patients (persons requiring a vaccination) arrive to the clinic. Additional details about the arrival process will be presented shortly.
Upon arrival, the patient’s pre-visit paperwork is checked to ensure that they have proper identification. If the arriving patient does not have the following: photo identification, insurance card, and scheduled visit confirmation, the patient will be asked to exit. After this check, the patient walks to the pre-vaccination area.
After arriving to the pre-vaccination area, the patient waits for a temperature check, ensures that their paperwork is in order, and receives their vaccination lot control number. A staff member at the pre-vaccination area assists the patient with these tasks. Patients with temperatures above a threshold are asked to get a COVID test performed and to reschedule the vaccination, if necessary, on a different day. Patients might have arrived without a paper copy of their insurance or driver’s license. If so, a photocopier is used to record a copy before proceeding. The staff member assisting the patient with their paperwork does not start on another patient until all tasks at the station are completed.
After getting their pre-vaccination paperwork in order, the patient moves to one of the available seats within the pre-vaccination seating area, where they must wait in an area that has been set up for social distancing for an available vaccination nurse.
When a vaccination nurse is available, the patient moves to a seat with a vaccination nurse. The vaccination includes the following time elements:
The nurse receives the patient paperwork, files the consent form, and records the pharmacy data and name on the vaccine record card.
The patient prepares for the injection by baring a preferred upper arm.
After changing to fresh gloves, the nurse swabs the upper arm of the patient.
The nurse injects the vaccination.
The nurse provides basic information about the vaccination and what to do next.
After the attending the patient, the nurse ensures that the area is clean for the next patient.
After vaccination the patient collects their belongings and walks to the post-vaccination area.
At the post-vaccination area, a clerk checks if the patient wrote their name and date of birth on their vaccination card, informs the patient to use the scheduling link to schedule an appointment to return for the 2nd dose of the vaccine, and informs the patient about the 15-minute post-vaccine waiting period.
The patient must then sit in a waiting area for a required 15-minute time interval to ensure that there are no issues with an allergic reaction. The patients in the post-vaccination area must be monitored by at least one nurse for every 15 waiting patients.
If there are no issues during the post-vaccination waiting period, the patient can leave the clinic. Patients with an adverse reaction within the clinic are helped to a separate area and tended by emergency medical technicians.
While the vaccination process is relatively straightforward, there are a number of constraints, uncertainties, and issues that need to be addressed within the process to ensure that the process operates safely and effectively for all persons at the clinic.
The first assumption is that the process must be designed to meet a particular daily throughput. For example, the population, demographics, and stipulations of the contract may require that at least 600 people can be vaccinated per day over the period of time that the vaccination clinic operates. Generally, because of setup and cleaning operations, the clinics will be able to operate for at least 6 hours per day to justify operating and to meet their throughput requirement.
The second assumption is that the chain will roll out an on-line scheduling application that patients will be required to use to schedule their visit to the clinic. The scheduling application is used to control the number of people that will be processed throughout the day. The scheduling application permits the clinics operating hours (e. g. 6 hours) to be divided into time periods that can hold a fixed number of patients. For example, assuming that 600 people need to be scheduled in a 6-hour operating day, the 6 hours (360 minutes) can be divided into 36, 10-minute blocks of time for which about 16 or 17 patients can be scheduled. While the length, number of scheduling blocks, throughput requirement, and operating hours are input design parameters, the chain is explicitly interested in testing the following configuration:
600 patients per day
6 hours of operating time
36, 10-minute blocks
The design of the clinic should be based on basic service configurations involving the tables, chairs, and social distancing requirements. Two basic service table configurations are illustrated in Figures 8.35 and 8.36.

Figure 8.35: Basic eight-foot table service station with 2 lines

Figure 8.36: Basic eight-foot table service station with 1 line
Finally, folding chairs will be used for patients to wait in the pre-vaccination area as well as the post-vaccination area. The chairs must be placed at least 6 feet apart. Figure 8.37 illustrates 12 folding chairs arranged for patient waiting. The number of chairs and how they are arranged are important design considerations. The company would like recommendations about size and arrangement of the pre-vaccination and post vaccination areas to ensure patient safety, utilization of the area, and patient flow. Clearly, a number of different layouts based on the total number of chairs is possible.

Figure 8.37: Waiting area with 12 folding chairs and 4 seated patients
The placement and number of nurse/vaccination stations are of paramount importance to the operation of the clinic. The basic vaccination station has two chairs (one for the nurse and one for the patient) and a table for the nurse to utilize during the vaccination process. A nurse is dedicated to vaccinating the patient in a particular chair. The company is willing to consider a number of design configurations.

Figure 8.38: Two nurse/vaccination stations supported by one pharmacist
For a given set of nurse/vaccination stations, pharmacists are available to support the nurses. The pharmacist is needed to take the vaccine out of storage, load the hyper-dermic needle, and provide the needle and supplies to the nurse. In Figure 8.38, there is one pharmacist that is supporting two nurse/vaccination stations. In general, pharmacists prepare the vaccination dosages that the nurses inject into the patients. As shown in the figure, pharmacists have their own work area for performing this task. There can be one large work area with many pharmacists that support all nursing stations or multiple pharmacy stations assigned to support specific nursing stations. Because the number of patients on the schedule is known at the beginning of the day, the pharmacists will start preparing vaccine dosages for use at the nurse/vaccination stations when the clinic first opens and continue to prepare dosages throughout the day. The pharmacists prepare the dosages based on the number of patients scheduled for the day, regardless of whether or not the patient actually is processed within the clinic. In this manner, an inventory of ready-made dosages is built up in the pharmacy area for use throughout the day. Whenever four dosages are made, the dosages are transported to the nurse/vaccination station for use on patients. You can assume that there is always a volunteer available to move the dosages and that the time is based on the distance between the stations.
At the nurse/vaccination stations, the supplied vaccination doses are kept on hand, ready to use on patients. For simplicity, you can assume that the doses located within the nurse/vaccination area are close enough that any time to get a dose to a nurse at the station is negligible. If the quantity of doses at the nurse/vaccination station runs out, then the patients requiring a vaccination must wait until the inventory at the nurses/vaccination station is restocked. That is, patients cannot be vaccinated unless there is a dose ready for them.
Observation times for the pharmacist to fill a dose of the vaccine are available in a spreadsheet that accompanies this project. Unfortunately, during the operation of the clinic, incidents may arise that require a pharmacist’s attention such that a pharmacist is needed to resolve the situation. This happens rarely, but during this time the pharmacist that handles the incident is no longer available to perform the nurse support activities. You can assume that during a 6-hour period, there will be on average 2 incidents, Poisson distributed randomly occurring within the interval. The time to handle the incident is quite variable and has a mean of 20 minutes, exponentially distributed. Any of the available pharmacists can handle the incident and a pharmacist will complete their current dosage making activity before handling the incident.
A concern for the design is how many pharmacists should support a set of nurse/vaccination stations. That is, should there be 1 for every two stations or 2 for 6 stations, or other pharmacist to nurse ratios or arrangements?
The company is interested in determining the number of basic nurse/vaccination stations, layout, and support pharmacists that are necessary to handle various throughput requirements. An example layout of the key clinic elements is illustrated in Figure @fig(fig:CovidProjectSystemOverview). In the diagram, there is one station for check-in, temperature checking, pre-vaccination, pre-vaccination seating, vaccination, and post vaccination processing. The company would like a more realistic layout that accommodates the 600-person throughput scenario.
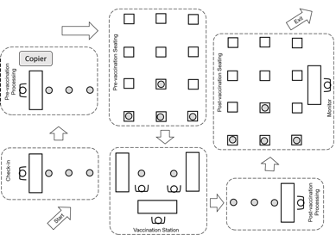
Figure 8.39: Simplified diagram with key clinic elements
A major constraint for the design of the clinic is the amount of square footage and how it is allocated to ensure that the social distancing requirements are met. In general, patients waiting for service during any part of the process must be able to maintain a 6-foot distance between themselves and other patients. In addition, workers that provide service to patients must be placed to ensure at least 6 feet of distance between each other. Eight-foot tables will be used to facilitate the placement of workers that are allocated to the check-in process, temperature checking, pre-vaccination, and post-vaccination checkout. In addition, small 1 foot tape dots can be placed within the facility to indicate locations where patients are permitted to stand. You may assume that you have up to 9000 square-feet of space for any design configurations you recommend; however, since rented space to operate the clinic can be expensive, you should try to minimize the amount of space (in square-feet) for your designs, while ensuring that you do not exceed 9000 square-feet of space. You should specify as part of your design approximately how many square feet should be dedicated to the major areas of the clinic (check-in, pre-vaccination, pre-vaccination waiting, vaccination, post-vaccination, and post-vaccination seating).
Given the company’s experience with providing flu vaccinations, they have acquired some data about the various processes; however, in some cases, they have only estimated values from domain experts. They are especially interested in understanding how the quality of the data might affect the operating projections for the clinics. The available data is summarized as follows:
Even though patients may arrive at any time within a scheduling block, they tend to arrive near the start of the block, with separation between patients primarily due to walking from their cars. That is, not all patients scheduled for a particular block arrive to the clinic at exactly the start of the block. For simplicity, assume that the average distance from the parking lot to the clinic is approximately 50 yards.
The speed of people walking can vary greatly, but prior data suggests that for short distances within and around buildings with social distancing, people walk between 1 miles per hour and 3 miles per hour, with a most likely time of 2 miles per hour.
Because this is a new vaccine, data on no shows (people who schedule but fail to show up for the appointment) is not readily available. However, no show rates for general appointments at healthcare clinics can be significant, ranging between 12% to 24%. While the company does not think that no shows will be that high for a vaccine, there is some concern about how no shows may affect the operation of the clinic. For simplicity, you should assume that there is a small chance of a no show, approximately, 1%, but the sensitivity to this assumption should be checked.
A very small percentage (0.5%) of patients try to enter the facility without the required items. The requirements are explained and those that don’t have the items need to leave. It is estimated that this check takes between 2 to 4 seconds.
Under the assumption that a person having a high temperature is due to COVID, the chance that someone does not pass the temperature screening can be estimated based on the per person probability of infection. For example, if there are 50,000 new cases in a state of 10 million, the per-person probability is 0.5 percent. Because this can vary significantly by region and many other factors, this variable should be an input parameter for the model. For simplicity assume that 0.5% of the arriving patients will not pass the temperature screening. The temperature check takes between 5 and 15 seconds, uniformly distributed.
Approximately, 2% of the arriving patients will not have their paperwork in order. It is estimated that it takes between 45 and 90 seconds uniformly distributed to use a photocopier to ensure paperwork compliance.
Data associated with the pre-vaccination, vaccination and check-out processes is available in the provided spreadsheet for analysis and use within the modeling.
Allergic reaction rates to the new vaccine are just beginning to be estimated but were extremely rare within the clinical trials. The chance of an allergic reaction should also be an input parameter so that sensitivity analysis can be performed. For simplicity, assume that initial data indicates that 0.002% of the post-vaccination patients will have an allergic reaction to the vaccine.
The patient schedule system is proprietary, and it has been difficult to get data on such a new process. Thus, some rough approximations will be required to model the demand for scheduling slots. The number of people expected to schedule an appointment on a given day is quite variable and is thought to be Poisson with a mean rate that will vary based on the population served. While the company would like design recommendations for different arrival rates, they specifically want a configuration for the case of a mean demand rate of 600 people per day. Data on scheduling clinics indicates that there are two types of scheduling preferences: 1) those people that have very flexible schedules and can pick any of the available slots at random and 2) those people that prefer slots that are later in the day. The break down between the two types of preferences really depends on the demographics of the underlying population (e.g. retirees tend to have more flexible schedules). For simplicity, you can assume that 60% of the people prefer late time windows and the remaining 40% have no preference. For those people that prefer late time windows, the general pattern has been as shown in Table 1.
| Time period (hour of the day) | Chance of selection |
|---|---|
| 1 | 5% |
| 2 | 5% |
| 3 | 10% |
| 4 | 20% |
| 5 | 30% |
| 6 | 30% |
There was no data available on finer time periods. For simplicity, you can assume that within any of the hourly periods, finer division of the time periods would be equally likely to be chosen.
While the clinic is scheduled to be open for a fixed time period, e. g. 6 hours, all patients that enter the clinic during its operation must be processed. In addition, the company is committed to serving all patients that desire a vaccine on a given day. Thus, no limit is placed on the number of people that can be scheduled within a block; however, the company would like this monitored closely and accounted for within any design or staffing plan.
The company is interested in understanding the statistical properties of the following metrics:
The probability that the clinic has to process patients after the scheduled operating hours.
The number of patients in the clinic at the end of its scheduled operating length.
The average time that patients spend waiting for each process.
The total time that a patient spends in the clinic and how that time is broken down into the various waiting and activities.
The utilization of the vaccination nurses.
The utilization of the pharmacists.
The utilization of the workers assigned to check-in, check-out, and pre-vaccination.
The number of patients waiting to be vaccinated.
The number of patients waiting in the post-vaccination area.
The probability that arriving patients cannot enter the building due to inadequate social distancing space or bottlenecks within the process.
The average waiting time of patients based on the hour of the day
The utilization of the staff by hour of the day.
The company would like to know how to staff each area for demand rates of 550, 600, 650, 700 patients per day. That is, how many vaccination stations should they have and how many workers should be allocated to check-in, temperature checking, pre-vaccination, and post-vaccination. They would also like to determine the size of the waiting areas (i.e. the number of seats) and the square footage required for each processing area based on social distancing requirements. The general goal is to have 80% of the patients experience a total vaccination experience time of less than 35 minutes. In addition, they would like to have 70% of patients in any hour of operation experience a total vaccination experience time of less than 35 minutes.
There has been some debate about how to organize and manage the waiting lines within the clinic and pre-vaccination waiting area. In particular, should individual lines be allocated to each nurse at each station or should a single line be used to feed multiple nurses that operate in parallel? For the pre-vaccination waiting area, the company is interested in recommendations that allow for fair and effective movement of patients waiting for a vaccination nurse. How will patients waiting within a general seating area know when it is their turn to proceed for a vaccination? The walking of patients within the facility should be accounted for within your solution.
While the staffing recommendations are of paramount importance, the company would like to know if changing the scheduling windows would be worthwhile. In addition, given the possibility of no shows, the company would like to understand how much over scheduling they should permit. That is, if the clinic is designed for mean demand of 600 people per day, how high can the rate go before the design needs to be changed? For a base configuration, the company is interested in an animation of the layout in order to assess the validity of the model and be used to educate personnel that need to manage the clinics.