2.9 Attributes, Variables, and Some I/O
In this section, we will dig deeper into the concepts of attributes and variables. In addition, an introduction to some additional statistical collection will be discussed. Finally, we will see how to write data to a file. To illustrate these concepts, we will expand upon the pharmacy model.
2.9.1 Modifying the Pharmacy Model
Suppose that customers who arrive to the pharmacy have either 1, 2, or 3 prescriptions to be filled. There is a 50% chance that they have 1 prescription to fill, a 30% chance that they have 2 prescriptions to fill, and a 20% chance that they have 3 prescriptions to fill. The time to service a customer is still exponentially distributed but the mean varies according to how many prescriptions that they need filled as shown in Table 2.16.
| # Prescription | Chance | Service Time Mean |
|---|---|---|
| 1 | 50% | 3 minutes |
| 2 | 30% | 4 minutes |
| 3 | 20% | 5 minutes |
For illustrative purposes, the current number of customers having 1, 2, or 3 prescriptions in system is needed within the animation of the model. In addition, the total number of prescriptions in the system should also be displayed. Statistics should be collected on the average number of prescriptions in the system and on the average time a customer spends in the system. For diagnostic purposes, the following information should be captured to a file:
When a customer arrives: The current simulation time, the entity number (IDENT), the entity’s serial number, the number of prescriptions for the customer
When a customer departs: The current simulation time, the entity number (IDENT), the entity’s serial number, the number of prescriptions for the customer, and the time of arrival, and the total time spent in the system
In addition to the above information, each of the above two cases should be denoted in the output. The simulation should be run for only 30 customers.
As we saw earlier in the chapter, you should follow a basic modeling recipe and address the following steps:
What is the system?
What are the elements of the system?
What information is known by the system?
What are the required performance measures?
What are the entity types?
What information must be recorded or remembered for each entity instance?
How are entities (entity instances) introduced into the system?
What are the resources that are used by the entity types?
- Which entity types use which resources and how?
What are the process flows? Sketch the process or make an activity flow diagram
Develop pseudo-code for the situation
Implement the model in Arena
By considering each of these questions in turn, you should have a good start in modeling the system.
In this example, the system is again the pharmacy and its waiting line. The system knows about the chance for each prescription amount, the inter-arrival time distribution, and the service time distributions with their means by prescription amount. The system must also keep track of how many prescriptions of each type are in the pharmacy and the total number of prescriptions in the pharmacy. The performance of the system will be measured by using the average number of prescriptions in the system and the average time a customer spends in the system. As in the previous model, the entity will be the customers. Each customer must know the number of prescriptions needed. As before, each customer requires a pharmacist to have their prescription filled. The activity diagram will be exactly the same as shown in Figure 2.29 because the activity and use of resources of the customer has not changed.
When implementing this model, the following modules will be used:
CREATE This module will be used to create the 30 customers
ASSIGN This module will be used to assign values to variables and attributes.
READ/WRITE This module will be used to write out the necessary information from the customers.
PROCESS This module will be used to implement the prescription filling activity with the required pharmacist.
RECORD This module will be used to record statistics on the system time of the customers
DISPOSE This module will be used to dispose of the entities that were created.
FILE This data module defines the characteristics of the operating system file used by the READ/WRITE module.
VARIABLE This data module will be used to define variables to track the number of customers having the different amounts of prescriptions and to track the total number of prescriptions.
ATTRIBUTE This data module will be used to define attributes associated with the customer.
Thus, the new modules are the READ/WRITE module, the FILE module, and the RECORD module.
To start the modeling, the variables and attributes necessary for the
problem need to be understood. In the problem, the system needs to keep
track of the total number of prescriptions and the number of customers
that need 1, 2, or 3 prescriptions filled. Therefore, variables to keep
track of each of these items are required. A scalar variable can be used
to track the number of prescriptions (vNumPrescriptions) in the system
and a 1-D variable (vNP) with 3 elements can be used to track the
number of customers requiring each of the 3 prescription amounts.
In the example, each customer needs to know how many prescriptions that
he/she needs to have filled. Therefore, the number of prescriptions
(myNP) needs to be an entity attribute. In addition, the arrival time of
each customer and the customer’s total time in the system must be
written out to a file. Thus, each entity representing a customer must
remember when it arrived to the pharmacy. Do real customers need to
remember this information? No! However, the modeling requires this
information. Thus, attributes (and variables) can be additional
characteristics required by the modeler that are not necessarily part of
the real system. Thus, the arrival time (myArriveTime) of each
customer should be modeled as an entity attribute.
To understand why this information must be stored in an attribute consider what would happen if you tried to use a variable to store the number of prescriptions of the incoming customer. Entities move from one block to another during the simulation. In general, entities may delay their progress due to simulation logic. When this happens, other entities are allowed to move. If the number of prescriptions for a specific customer instance was stored in a (global) variable, then during the movement cycle of the other entities (customers), some other entity instance might change the value of the variable. Thus, the information concerning the current customer’s number of prescriptions would be over written by the next customer that enters the system. Thus, this information must be carried with the entity and not stored globally. Global variables are very useful for communicating information between entities; however, as in any programming language care must be taken to use them correctly.
The information in Table 2.16 also needs to be modeled. Does this information belong to the system or to each customer? While the information is about customers (in general), each customer does not need to "carry" this information. The information is really about how to create the customers. In other words, it is about the entity type not the entity instance. The system must know how to create the customers, thus this information belongs to the system. The number of prescriptions per customer can be modeled as a random variable with a discrete distribution. The information about the mean of the service time distributions can be kept in a 1-D variable with 3 elements representing the mean of each distribution. The basic pseudo-code for this situation is given in the following pseudo-code.
CREATE customers with EXPO(6) time between arrivals
BEGIN ASSIGN
  myNP = DISC(0.5, 1, 0.8, 2, 1.0, 3)
  vNumPrescriptions = vNumPrescriptions + myNP
  vNP(myNP) = vNP(myNP) + 1
  myArriveTime = TNOW  //TNOW represents the current simulation time
END ASSIGN
WRITE customer arrival information to a file
BEGIN PROCESS
  SEIZE 1 pharmacist
  DELAY for EXPO(3) minutes
  RELEASE 1 pharmacist
END PROCESS
RECORD (TNOW - myArriveTime)
WRITE customer departure information to a file
DISPOSE customer
In what follows, the previously developed pharmacy model will be used as a basis for making the necessary changes for this situation. If you want to follow along with the construction of the model, then make a copy of the pharmacy model of Section 2.6.2. You should start by defining the variables for the example. With your copy of the model open, go to the Basic Panel and select the VARIABLE data module and define the following variables:
vNumPrescriptionsThis scalar variable should count the total number of prescriptions in the system. This variable should be initialized at the value 0.0.vNPThis 1-D variable should have 3 rows and should count the number of customers having 1, 2, 3 prescriptions currently in the system. The index into the array is the prescription quantity. Each element of this variable should be initialized at the value 0.0.vServiceMeanThis 1-D variable should have 3 rows representing the mean of the service distributions for the 3 prescription quantities. The index into the array is the prescription quantity. The elements (1, 2, 3) of this variable should be initialized at the values 3, 4, 5 respectively.
Given the information concerning the variables, the variables can be defined as shown in Figure 2.57. For scalar variables, you can tell Arena to automatically report statistics on the time average value of the variable. Chapter 3 will more formally define time-average statistics, but for now you can think of them as computing the average value of the variable over time. The initial values can be easily defined using the spreadsheet view.
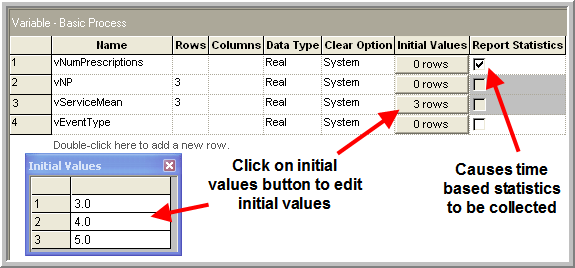
Figure 2.57: Defining the variables
Now, you are ready to modify the modules from the previous model within the model window. The CREATE module is already in the model. In what follows, you will be inserting some modules between the CREATE module and the PROCESS module and inserting some modules between the PROCESS module and the DISPOSE module. You should select and delete the connector links between these modules. You should then drag an ASSIGN module from the Basic Process panel to the model window so that you can connect it to the CREATE module.
2.9.2 Using the ASSIGN Module
Because the ASSIGN module is directly connected to the CREATE module,
each entity that is created will pass through the ASSIGN module causing
each assignment statement to be executed in the order in which the
assignments are listed in the module. The ASSIGN module simply
represents a series of logical assignment, e.g. Let X = 2, as you would
have in any common programming language.
Figure 2.58 illustrates the dialog boxes
associated with the ASSIGN module. Using the Add button, you can add a
new assignment to the list of assignments for the module. Add an
attribute named, myNP and assign it the value returned from DISC(0.5, 1, 0.8, 2, 1.0, 3).
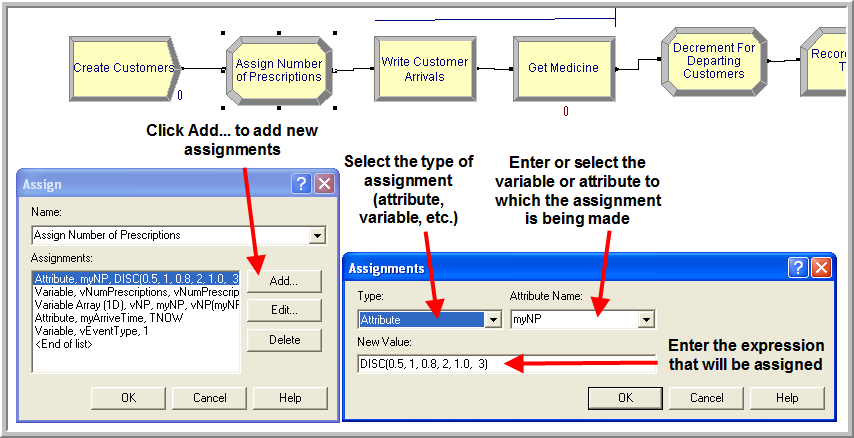
Figure 2.58: Assigning the number of prescriptions
The function DISC(\(cp_1, v_1, cp_2, v_2, \cdots, cp_n, v_n\)) will supply a random number according to a discrete probability function, where \(cp_i\) are cumulative probabilities and \(v_i\) is the value, i.e. \(P(X = v_i) = cp_{i+1} - cp_i\) with \(cp_0\) = 0 and \(cp_n\) = 1. The last cumulative value must be 1.0 since it must define a probability distribution. For this situation, there is a 50% chance of having 1 prescription, a (80 – 50 = 30%) chance for 2 prescriptions, and (100 – 80 = 20%) chance for 3 prescriptions.
The Expression Builder can be using to build complicated expressions by right-clicking in the text field and choosing Build Expression. Figure 2.59 illustrates the Expression Builder with the DISC distribution function and shows a list of available probability distributions. Once the number of prescriptions has been assigned to the incoming customer, you can update the variables that keep track of the number of customers with the given number of prescriptions and the total number of prescriptions. As an alternative to the dialog view of the ASSIGN module, you can use the spreadsheet view as illustrated in Figure 2.60.
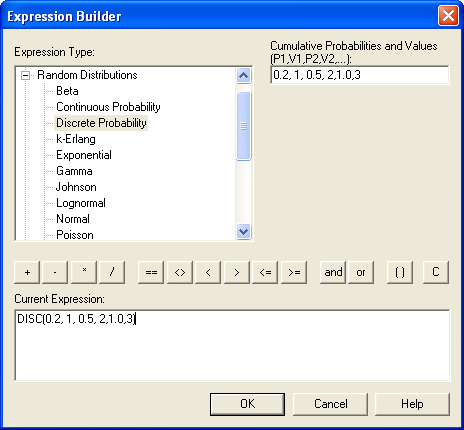
Figure 2.59: Using the expression builder
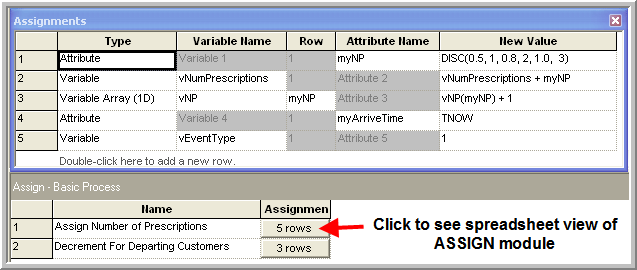
Figure 2.60: Data sheet view of ASSIGN module
You should complete your ASSIGN module as shown in
Figure 2.60. The data sheet view of
Figure 2.60 clearly shows the order of the
assignments within the ASSIGN module. The order of the assignments is
important! The first assign is to the attribute myNP. This attribute
will have a value 1, 2, or 3 depending on the random draw caused by the
DISC function. This value represents the current customer’s number of
prescriptions and is used in the second assignment to increment the
variable that represents the total number of prescriptions in the
system. In the third assignment the attribute myNP is used to index
into the variable array that counts the number of customers in the
system with the given number of prescriptions. The fourth assignment
uses the variable TNOW to assign the current simulation time to the
attribute myArriveTime. TNOW holds the current simulation time. Thus,
the attribute, myArriveTime will contain the value associated with
TNOW when the customer arrived, so that when the customer departs the
total elapsed time in the system can be computed. The last assignment is
to a variable that will be used to denote the type of event 1 for
arrival, 2 for departure when writing out the customer’s information.
2.9.3 Using the READWRITE Module
As with any programming language, has the ability to read and write information from files. Often the READWRITE module is left to the coverage of miscellaneous topics; however, in this section, the READWRITE module is introduced so that you can be aware that it is available and possibly use it when debugging your models. The READWRITE module is very useful for writing information from a simulation and for capturing values from the simulation, for post processing, and other analysis.
This example uses the READWRITE module to write out the arriving and departing customer’s information to a text file. The information can be used to trace the customer’s actions through time. There are better ways to trace entities with , but this example uses the READWRITE module so that you can gain an understanding of how processes entities. In order to use the READWRITE module, you must first define the file to which the data will be written. You do this by using the FILE data module in the Advanced Process panel. To get the FILE dialog, insert a row into the file area and then choose edit via dialog from the right click context menu. Open the FILE dialog and make it look like FILE module shown in Figure 2.61. This will define a file within the operating system to which data can be written or from which data can be read. Arena’s FILE module allows the user to work with text files, Excel files, Access files, as well as the other access types available in the Access Type drop down menu dialog. In this case, the Sequential option has been chosen, which indicates to that the file will be a text file for which the records will be in the same sequence that they were written. In addition, the Free Format option has been selected, which essentially writes each value to the file separated by a space. You should review the help file on the FILE module for additional information on the other access types.
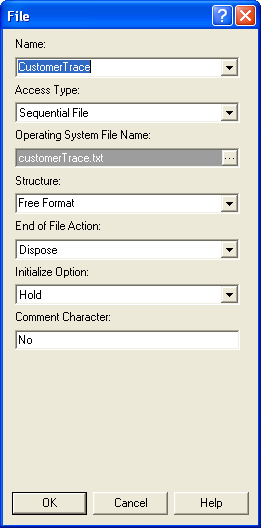
Figure 2.61: The FILE module
Now, open the READWRITE module and make it look like the READ/WRITE module given in Figure 2.62. Use the drop down menu to select the file that you just defined and use the Add button to tell the module what data to write out. After selecting the Add button, you should use the Type drop-down to select the data type of the item that you want to write out to the file and the item to write out. For the data type Other, you must type in the name of the item to be written out (it will not be available in a drop down context). In this case, the following is being written to the file:
TNOWthe current simulation timevEventTypethe type of event 1 for arrival, 2 for departureIDENTthe entity identity number of the customerEntity.SerialNumberthe serial number of the customer entitymyNPthe number of prescriptions for the customer
This information is primarily about the current (active) entity. The active entity is the entity that is currently moving through the model’s modules. In addition to writing out information about the active entity or the state of the system, the READ/WRITE module is quite useful for reading in parameter values at the beginning of the simulation and for writing out statistical values at the end of a simulation.
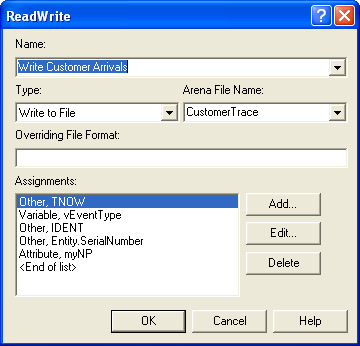
Figure 2.62: The READWRITE module
After writing out the values to the file, the customer entity proceeds
to the PROCESS module. Because the mean of the service time distribution
depends on the number of prescriptions, we need to change the PROCESS
module. In Figure 2.63, we use the 1-D array,
vServiceMean, and the attribute, myNP, to select the appropriate
mean for the exponential distribution in the PROCESS module. Remember
that the attribute myNP has a value 1, 2, or 3 depending on the number
of prescriptions for the customer. This value is used as the index into
the vServiceMean 1-D variable to select the appropriate mean. Since
has limited data structures, the ability to use arrays in this manner is
quite common.
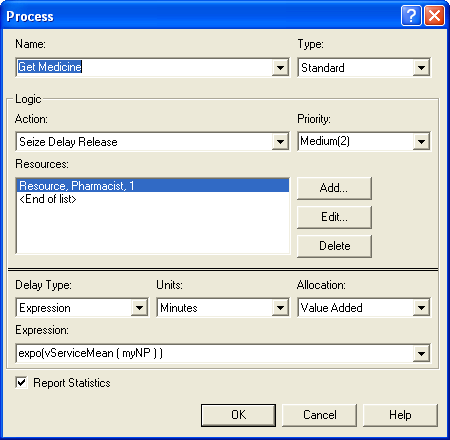
Figure 2.63: Changed PROCESS module
Now, that the customer has received service, you can update the
variables that keep track of the number of prescriptions in the system
and the number of customers having 1, 2, and 3 prescriptions. This can
be done with an ASSIGN module placed after the PROCESS module.
Figure 2.64 shows the assignments for after a
customer completes service. The first assignment decrements the global
variable, vNumPrescriptions, by the amount of prescriptions, myNP,
denoted by the current customer. Then, this same attribute is used to
index into the array that is counting the number of customers that have
1, 2, or 3 prescriptions to reduce the number by 1 since a customer of
the designated type is leaving. In preparation for writing the departing
customer’s information to the file, you should set the variable,
vEventType, to 2 to designate a departure.
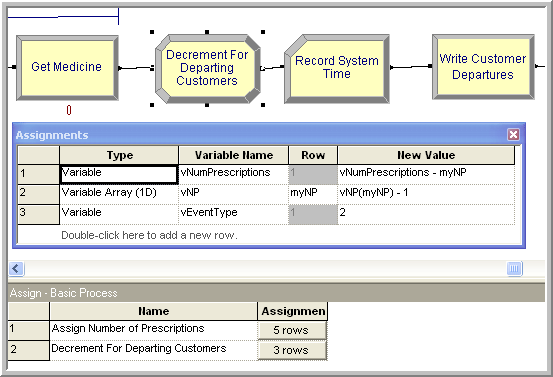
Figure 2.64: Updating variables after service
2.9.4 Using the RECORD Module
The problem states that the average time in the system must be computed. To do this, the RECORD module can be used. The RECORD module is found on the Basic Process panel. The RECORD module tabulates information each time an entity passes through it. The options include:
Count will increase or decrease the value of the named counter by the specified value.
Entity Statistics will generate general entity statistics, such as time and costing/duration information.
Time Interval will calculate and record the difference between a specified attribute’s value and the current simulation time.
Time Between will track and record the time between entities entering the module.
Expression will record the value of the specified expression.
Drag and drop the RECORD module after the previous ASSIGN module. Open
the record module and make it look like the RECORD module shown in
Figure 2.65. Make sure to choose the Expression
option. The RECORD module evaluates the expression given in the Value
text box field and passes the value to an internal function that
automatically tallies statistics (min, max, average, standard deviation,
count) on the value passed. Since the elapsed time in system is desired,
the current time minus when the customer arrived must be computed. The
results of the statistics will be shown on the default reports labeled
with the name of the tally, e.g. SystemTime. The Time Interval option
could also have been used by supplying the myArriveTime attribute. You
should explore and try out this option to see that the two options
produce the same results.
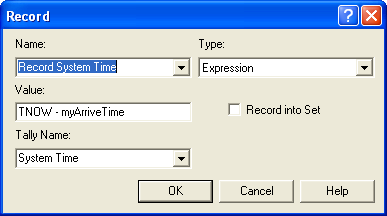
Figure 2.65: Using the RECORD module to capture system time
The final model change is to include another READWRITE module to write out the information about the departing customer. The READWRITE module also has a spreadsheet view for assigning the information that is to be read in or written out. Figure 2.66 shows the spreadsheet view for the departing customer’s READWRITE module.
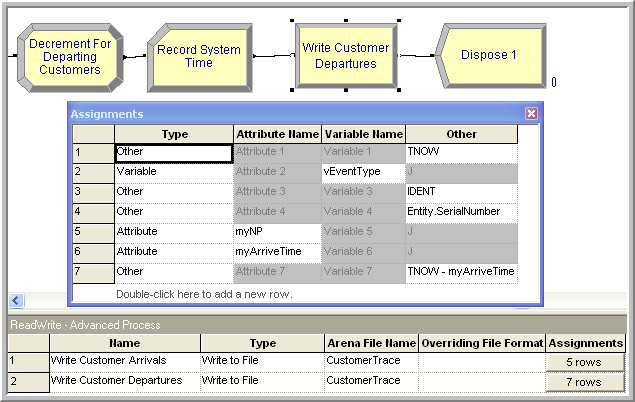
Figure 2.66: READWRITE module for departing customers
The module is set to first write out the simulation time via the
variable TNOW, then the type of event, vEventType, which was set to 2
in the previous ASSIGN module. Then, it writes out the information about
the departing entity (IDENT, Entity.SerialNumber, myNP, myArriveTime).
Finally, the system time for the customer is written out to the file.
2.9.5 Animating a Variable
The problem asks to have the value of the number of prescriptions currently in the system displayed in the model window. This can be done by using the variable animation features in Arena. Figure 2.67 shows the animation toolbar within . If the toolbar is not showing in your Environment, then you can right-click in the toolbar area and make sure that the Animate option is checked as shown in Figure 2.67.
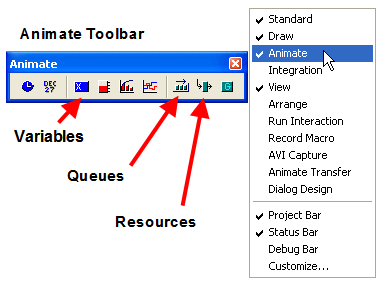
Figure 2.67: The Animate toolbar
You will use the Animate Variables option of the animate toolbar to
display the current number of prescriptions in the system. Click on the
button with the 0.0 on the toolbar. The animate variable dialog will
appear. See Figure 2.68. By using the drop down box labeled
Expression, you can select the appropriate item to display. After
filling out the dialog box and selecting OK, your cursor will change
from the arrow selection form to the cross-hairs form. By placing your
cursor in the model window and clicking you can indicate where you want
the animation to appear within the model window. After the first click,
drag over the area where you want the animation to size the animation
and then click again. After completing this process, you should have
something that looks like Figure 2.69. During the simulation run,
this area will display the variable vNumPrescriptions as it changes
with respect to time.
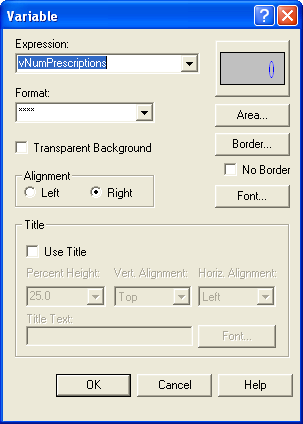
Figure 2.68: Animate variable dialog
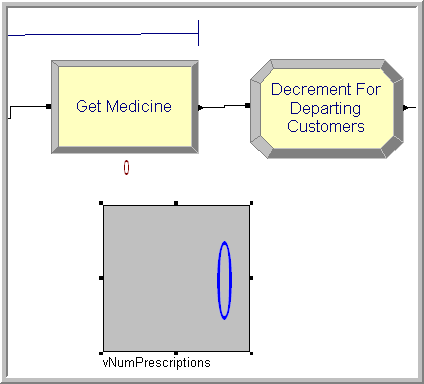
Figure 2.69: Animation of the prescriptions
2.9.6 Running the Model
Two final changes to the model are necessary to prepare the model to run only 30 customers. First, the maximum number of arrivals for the CREATE module must be set to 30. This will ensure that only 30 customers are created by the CREATE module. Second, the Run Setup \(>\) Replication Parameters dialog needs to indicate an infinite replication length.
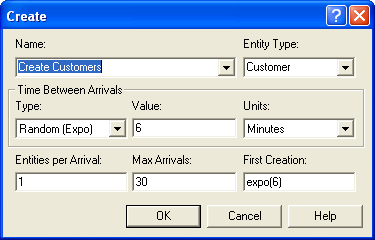
Figure 2.70: Creating only 30 customers
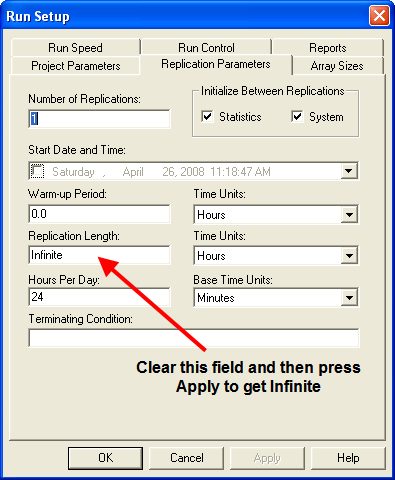
Figure 2.71: Run setup with no replication length
These two changes (shown in Figure2.70 and Figure2.71) ensure that the simulation will stop after 30 customers are created. If you do not specify a replication length for the simulation, will process whatever entities are created within the model until there are no more entities to process. If a maximum number of arrivals for the CREATE module is not specified and the replication length was infinite, then the simulation would never end
After completing all these changes to the model, use Run Setup \(>\) Check Model to check if there are any syntax errors in your model. If there are, you should carefully go back through the dialog boxes to make sure that you typed and specified everything correctly. The final file, PharmacyModelRevised.doe, is available in the supporting files for this chapter. To see the animation, you should make sure that you unchecked the Batch Run (No animation) option in the Run \(>\) Run Control menu. You should run your model and agree to see the simulation report. When you do, you should see that 30 entities passed through the system. By clicking on the User Specified area of the report you will see the statistics collected for the RECORD module and the VARIABLE module that was specified when constructing the model.
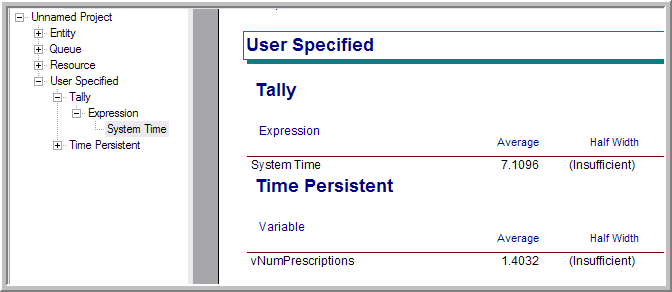
Figure 2.72: System time output report
Figure 2.72 indicates that the average system time of the 30 customers that departed the system was about 7.1096. Since the system time was written out for each departing customer, Arena’s calculations can be double-checked. After running the model, there should be a text file called customerTrace.txt in the same directory as where you ran the model. Table 2.17 shows the data from the first 5 customers through the system.
| Event | Serial | Number | Arrive | System | ||
| TNOW | Type | IDENT | Number | Prescriptions | Time | Time |
| 2.076914 | 1 | 2 | 1 | 1 | ||
| 2.257428 | 2 | 2 | 1 | 1 | 2.076914 | 0.180514 |
| 4.74824 | 1 | 3 | 2 | 1 | ||
| 5.592303 | 1 | 4 | 3 | 3 | ||
| 10.34295 | 1 | 5 | 4 | 1 | ||
| 13.31427 | 2 | 3 | 2 | 1 | 4.74824 | 8.566026 |
| 21.39914 | 1 | 6 | 5 | 1 | ||
| 21.89796 | 2 | 4 | 3 | 3 | 5.592303 | 16.30566 |
| 23.79078 | 2 | 5 | 4 | 1 | 10.342949 | 13.447826 |
| 26.0986 | 2 | 6 | 5 | 1 | 21.399139 | 4.699463 |
The table indicates that the first customer arrived at time 2.076914 with 1 prescription and was given the IDENT value 2 and serial number 1. The customer then departed, event type = 2, at time 2.257428 with a total system time of (2.257428 – 2.076914 = 0.180514). There were then three consecutive arrivals before the 2nd customer, (IDENT = 3, serial number 2) departed at time 13.31427. Thus, the 3rd and 4th customers had to wait in the queue. If you compute the average of the values of the system time column in the file, you would get the same value as that shown on the output reports.
In this example, you have learned more about the CREATE module and you have seen how you can define variables and attributes within your models. With the use of the ASSIGN module you can easily change the values of variables and attributes as entities move through the model. In addition, the RECORD module allows you to target specific quantities within the model for statistical analysis. Finally, the READWRITE module was used to write out information concerning the state of the system and the current entity when specific events occurred within the model. This is useful when diagnosing problems with the model or for capturing specific values to files for further analysis. The simple variable animation feature of was also demonstrated.
This example had a simple linear flow, with each module directly connected to the previous module. Complex systems often have more complicated flow patterns. Future chapters will illustrate these more complex flow processes. In the next section, we will study how Arena processes entities and events. This will provide a deeper understanding of what is going on “under the hood.”